Investing.com’s stocks of the week
Few “investment vehicles” attract more attention than gold. The shiny stuff. The precious metal. The store of value. Yada, yada, yada.
All my adult life I have seen the articles purporting that gold will be the ultimate asset when “disaster finally strikes.” And who knows, maybe they’re right. Still, when I picture myself trying to trade a gold bar for a bag of groceries I am not so sure. Plus, my own belief is that “(if and) when it all hits the fan” the three most valuable commodities will be canned food, shotgun shells and cabins in the woods. But that’s just me.
SPDR Gold Shares
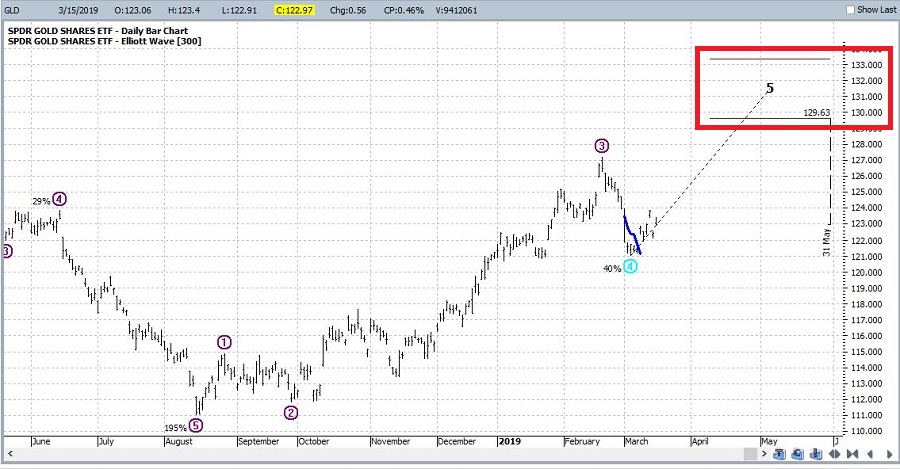
Figure 1 displays ticker SPDR Gold Shares (NYSE:GLD) (an ETF that purportedly tracks the price of gold bullion) with the daily Elliott Wave count generated by ProfitSource by HUBB. As you can see, it is suggesting a potential price move higher may be in the offing.

Figure 1 Courtesy ProfitSource by HUBB
Figure 2 displays the annual seasonal trend for gold from sentimentrader.com. As you can see the months ahead are not “gangbusters” bullish. However, I guess the key point in my mind is that it is not bearish. So, a bullish move would not have to “swim upstream” so to speak.
Figure 2 Courtesy Sentimentrader.com
OK, the usual caveats. I am not professing that I am bullish on GLD nor am I “recommending” the trades that follow. The trades are presented as an example of different ways to play a potentially bullish situation while exposing oneself to only a low dollar risk.
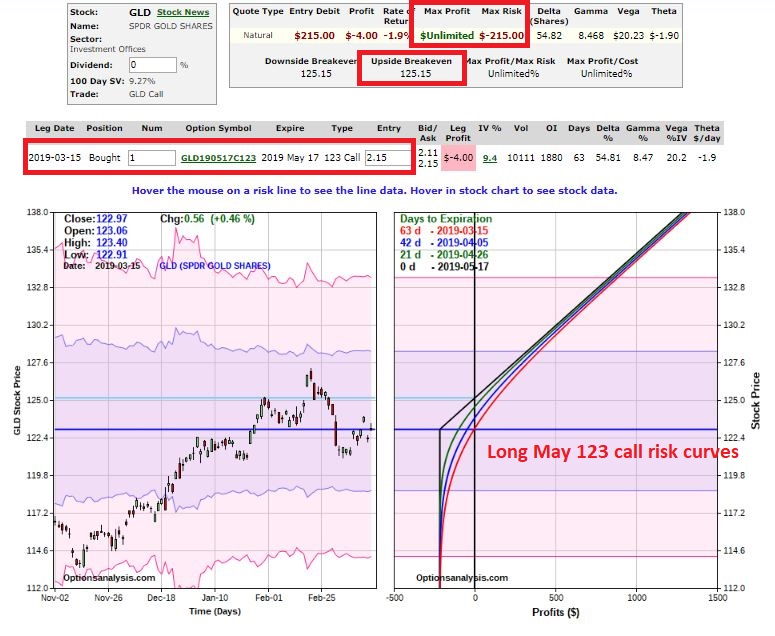
Figure 3 displays the risk curves for buying 1 May GLD 123 call @ $2.15. The key things to note are:
*A maximum dollar risk of -$215
*Unlimited profit potential
*A breakeven price of $125.15 for GLD shares (trading at $122.97 as I type)

Figure 3 Courtesy OptionsAnalysis.com
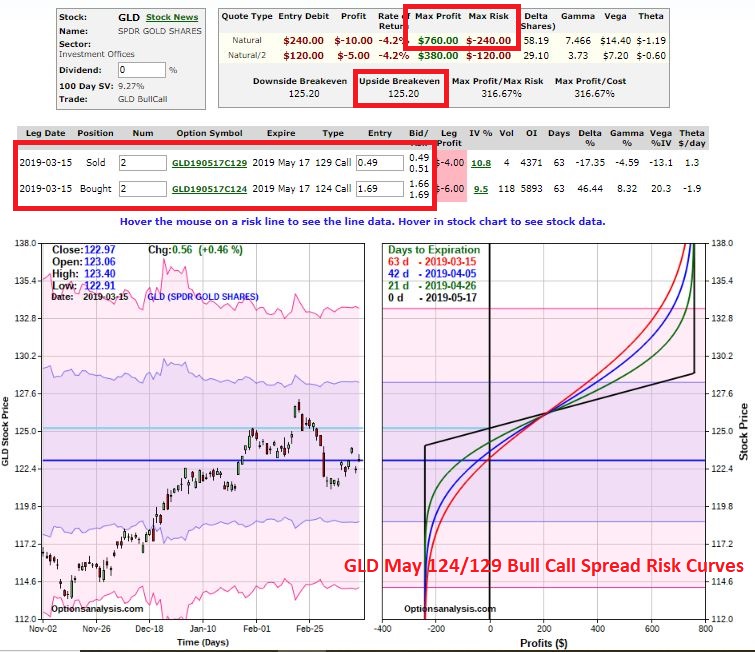
Figure 4 displays a bull call spread for GLD
*A maximum dollar risk of -$240
*Maximum profit potential of +$760 (if GLD reaches $129 a share)
*A breakeven price of $125.20 for GLD shares (trading at $122.97 as I type)

Figure 4 Courtesy OptionsAnalysis.com
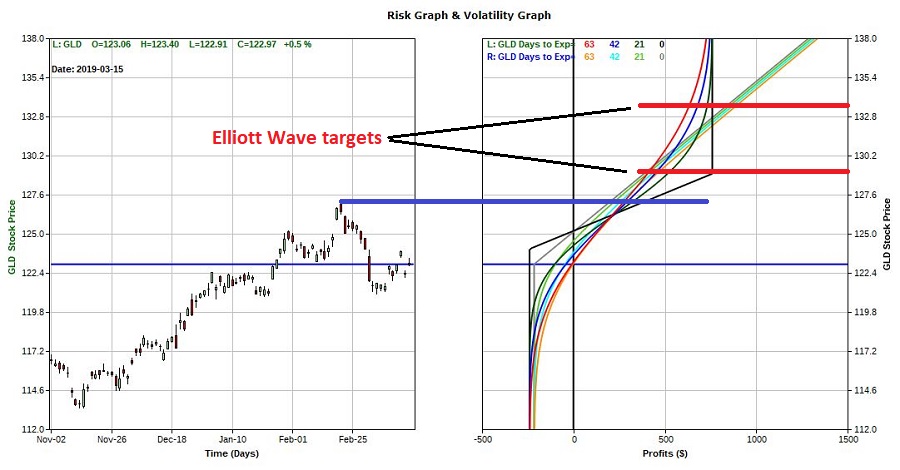
At first blush the lower cost and breakeven price plus the unlimited profit potential makes the long call position attractive. However, a close examination of Figure 5 (which overlays the risk curves for the two trades) reveals that the bull call spread may be more attractive at any price above roughly $126 through roughly $131 a share for GLD.

Figure 5 Courtesy OptionsAnalysis.com
Summary
The key points:
*The daily Elliott Wave count from ProfitSource by HUBB (and a whole lot of diehard gold bugs out there) are suggesting gold may move higher soon. There are ways to “make the play” without risking large sums of capital.
*I personally am not offering any opinion; however, I have highlighted a couple of ways that a trader might play a bullish opinion on gold for less than $250 – i.e., without going out and buying actual physical gold, or assuming the risk of going long gold futures, or even ponying up roughly $12,300 to buy 100 shares of GLD.
How it all works out, only time will tell.
