Markets and stocks started the week out on a rough note but there wasn’t any panic selling and stocks who’ve been strong held up well so I held onto almost everything and even added a bit on Tuesday.
Then we turned around well and ended the week constructively.
Markets and stocks look great still and ready to move into new highs.
That said, we are moving into summer and that isn’t usually when we see such moves but it doesn’t mean it won’t happen.
For now, I remain very heavy in stocks but am always ready to lock in already nice gains if we get a real show of weakness since these gains I’ve accumulated over the past few weeks can disappear in a single day as we’ve seen most recently in early May.
The metals dropped early in the week as I suggested here last weekend was next and now they are just setting up for lower again most likely so let’s take a look at the metals before I spend most of my focus this weekend finding the next big winners for subscribers.

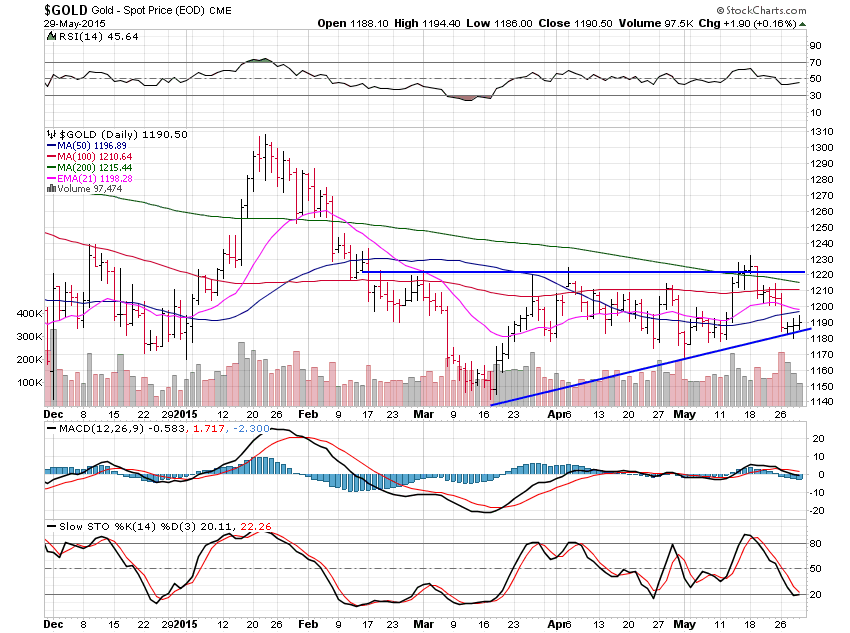
Gold lost 1.24% this past week after failing to breakout above the $1,220 resistance level.
Gold now has a small bear flag pattern which tells me it will break below the triangle at $1,190 very soon.
Support now sits below at $1,170 and then $1,150 and the dominant trend remains lower.
I’m not getting those fun nasty emails from the perma-bulls anymore so that always gives me a chuckle.
I really don’t care if gold rises or falls, I just read the charts while some people get so emotionally attached.
I’m in this great stock market game to make money, plain and simple.
I don’t get emotional about stocks or anything I’m trading.
I look for the strongest sectors and then I find the best stocks within those sectors and that is a proven method to making money.
If I want to be right about something, the stock market is not the place to play that game.

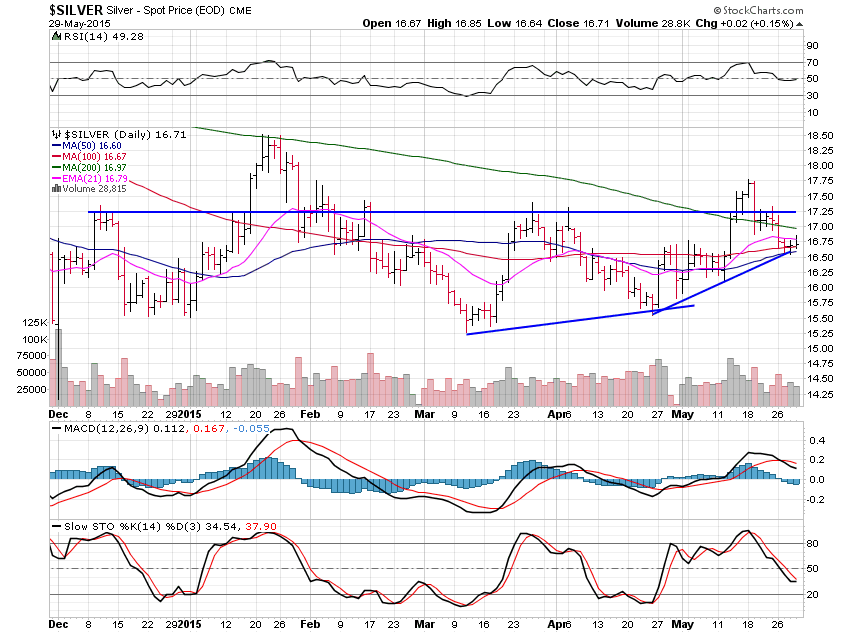
Silver lost 2.31% over the holiday shortened week and also showed us a failed breakout.
Now it’s setup to break below the uptrend line and moving average support area at $16.70.
The next support level to look for if silver breaks lower is still $15.75.
$17.25 remains resistance on the upside should we head that way but odds do not favour it.

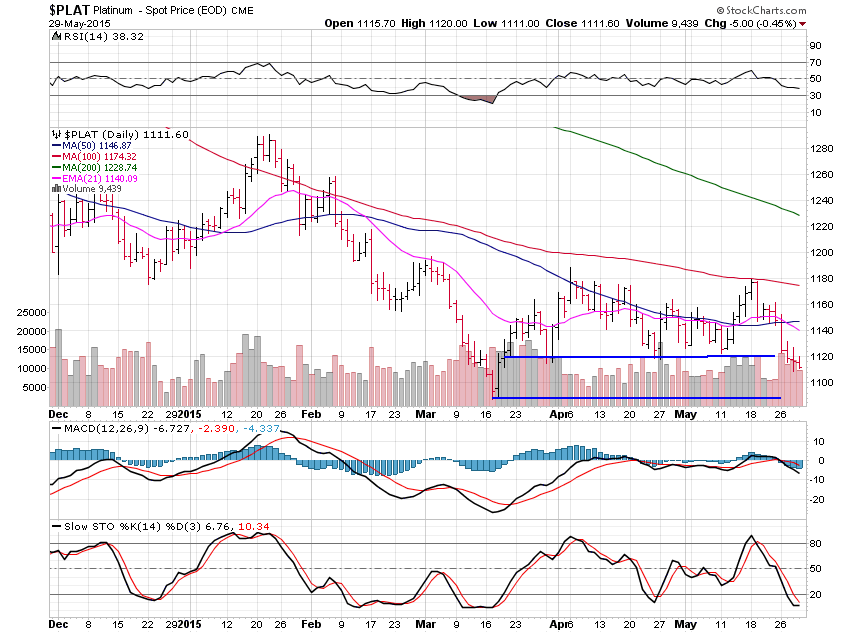
Platinum fell 0.46% this past week and is rolling over well.
Support sits at the $1,190 area for now and that level can be hit very soon, especially if gold breaks its support level.
The major trend lower is showing its force once again.

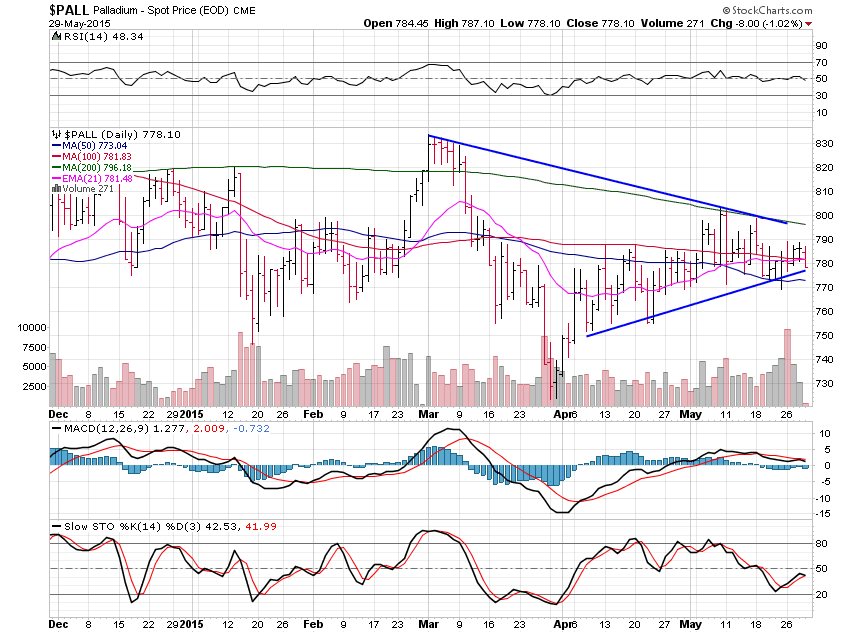
Palladium fell only 0.37% and is holding up much better than the other 3 metals but as always, it will follow gold and silver if they move lower.
Palladium is trading quite tight here but is most likely going to see the next major move be to the downside.
A break under the $775 area should take it to support at $760 and then we have to look lower to $730 for the next support area.
Have a great weekend, it’s so nice to finally see some nice weather arriving in my area after a long, long winter so I’m going to get out and enjoy it.