This is an overview of various charts that I am hoping will provide insight into the inflation/deflation debate. The interpretation of these charts should provide another gauge of inflation, and will complement the analysis of governmental reports. After reviewing these charts, it appears to me inflation remains in check.
The first chart is the Goldman Sachs Commodity Index. The bearish trend channel pattern, shown in red, remains intact. It’s hard to imagine inflation without commodities in a bull market. We should continue to watch this chart for any upside break-out.
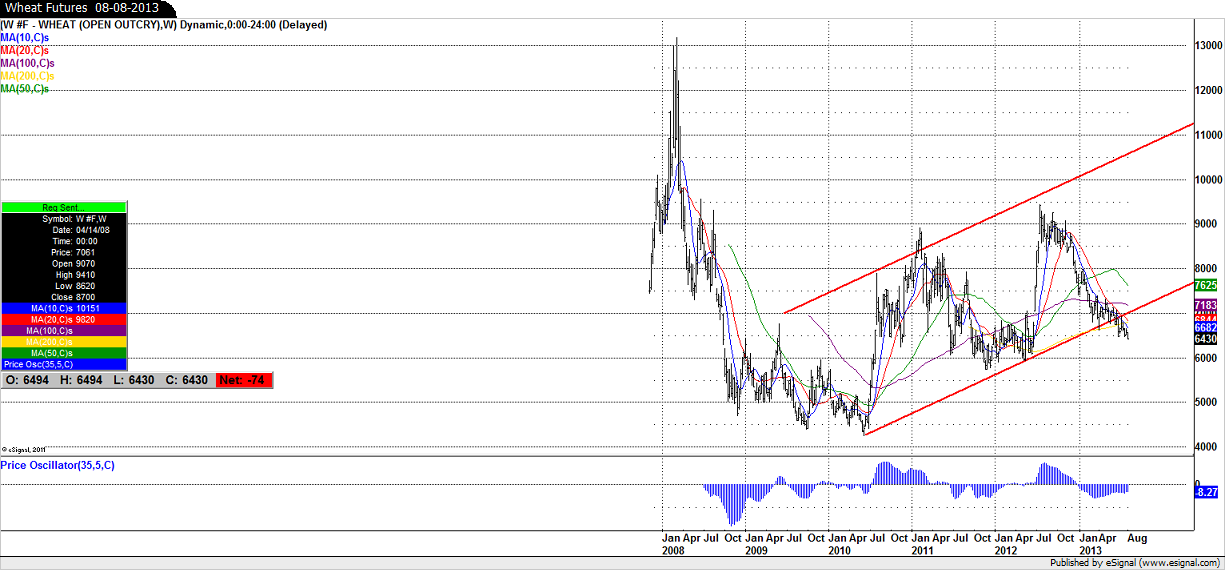
The next chart is wheat futures. You can clearly see how wheat futures have indeed broken beneath bullish trend channel support. However, I will wait until wheat futures break $6.00 to call a bear market for wheat.
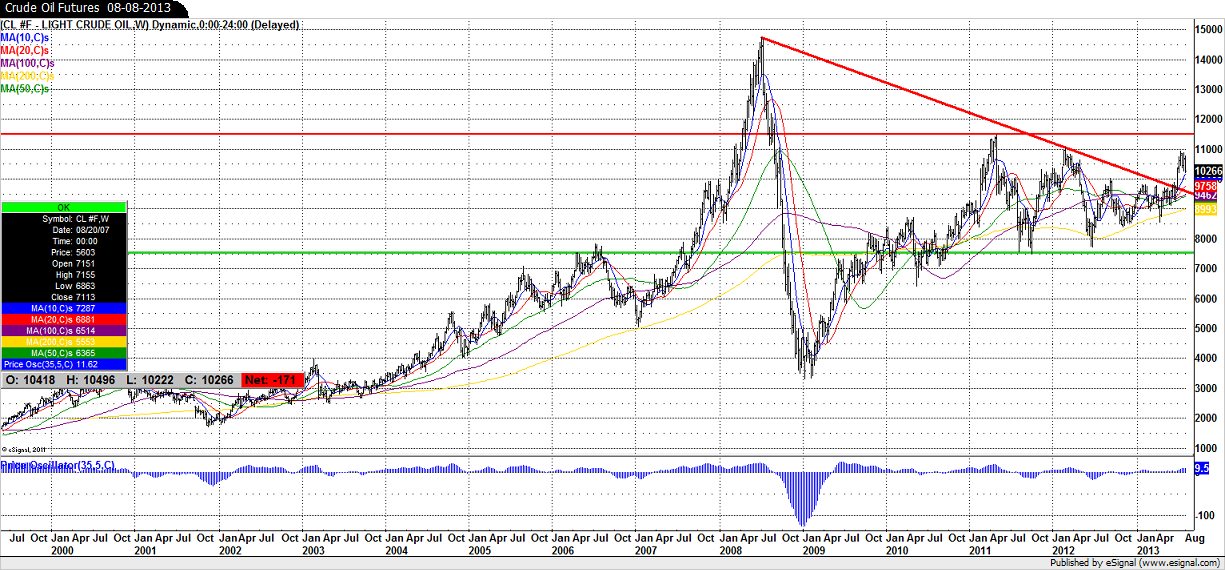
As you’ll next see, crude oil futures are inflation’s only supporter in this analysis, and not a very strong one at that. The downward sloping bearish red trend line has been broken, but I think the more dominant trend is a sideways consolidation between $75.00/barrel and $115.00/barrel area. If I’m correct, then crude oil futures have consolidated sideways since the beginning of 2011, and are not yet forecasting inflation.
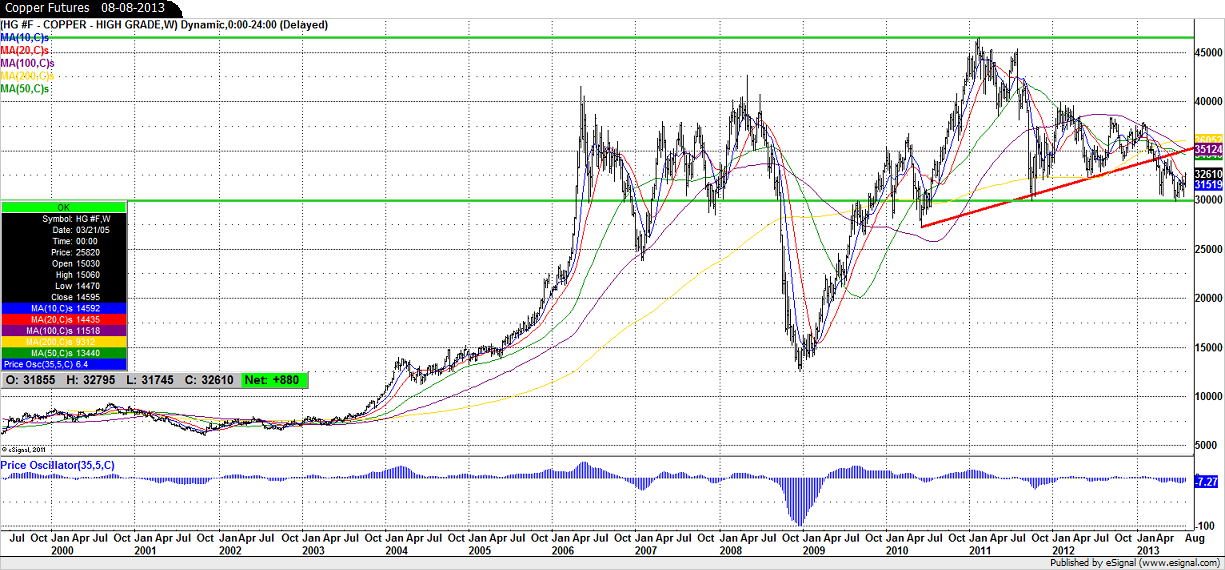
Copper futures remain listless and are in fact testing long term support at 3.0000.
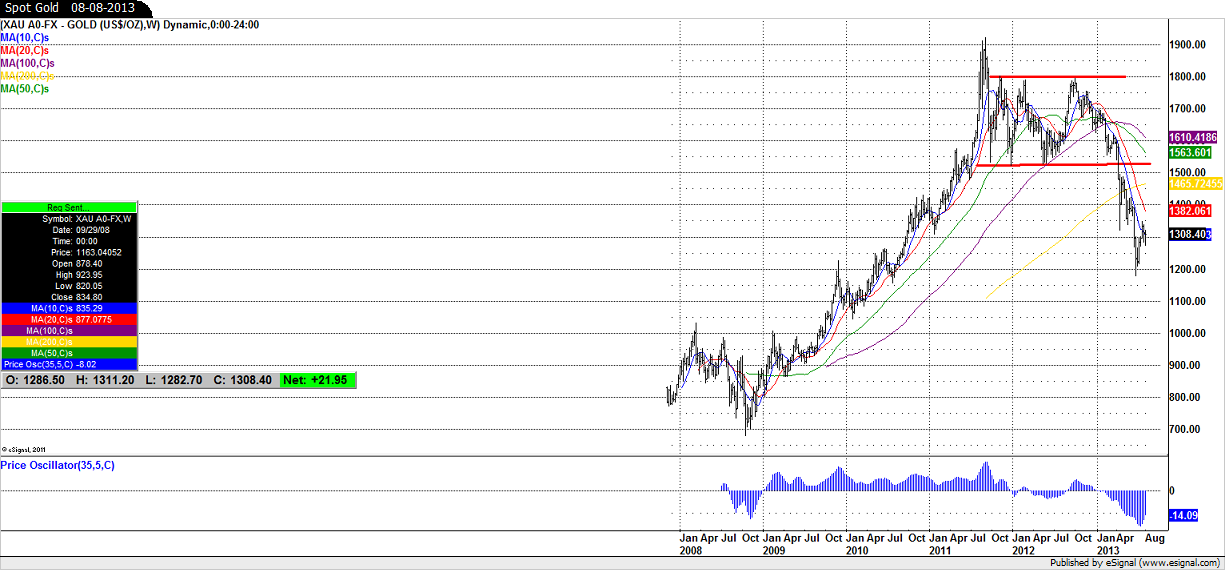
Once they broke out of their sideways consolidation, spot gold prices have retreated significantly. Similarly to commodities in general, gold prices should turn around and move higher if inflation gains a foothold.
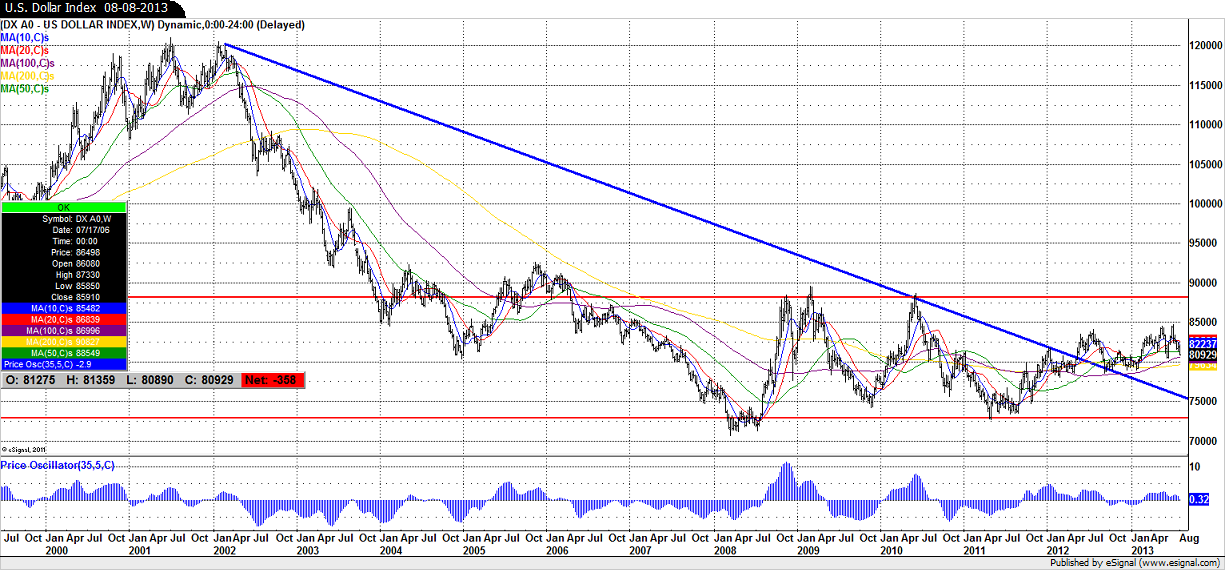
Finally, the U.S. Dollar Index remains benign, having traded sideways since 2008, the year in which it placed its all-time low.
In conclusion, charts are objective and speak for themselves. According to my interpretation of these charts, inflation remains in check even as global governments have utilized trillions of dollars to prop up their economies. Perhaps deflation remains a possibility that few consider. 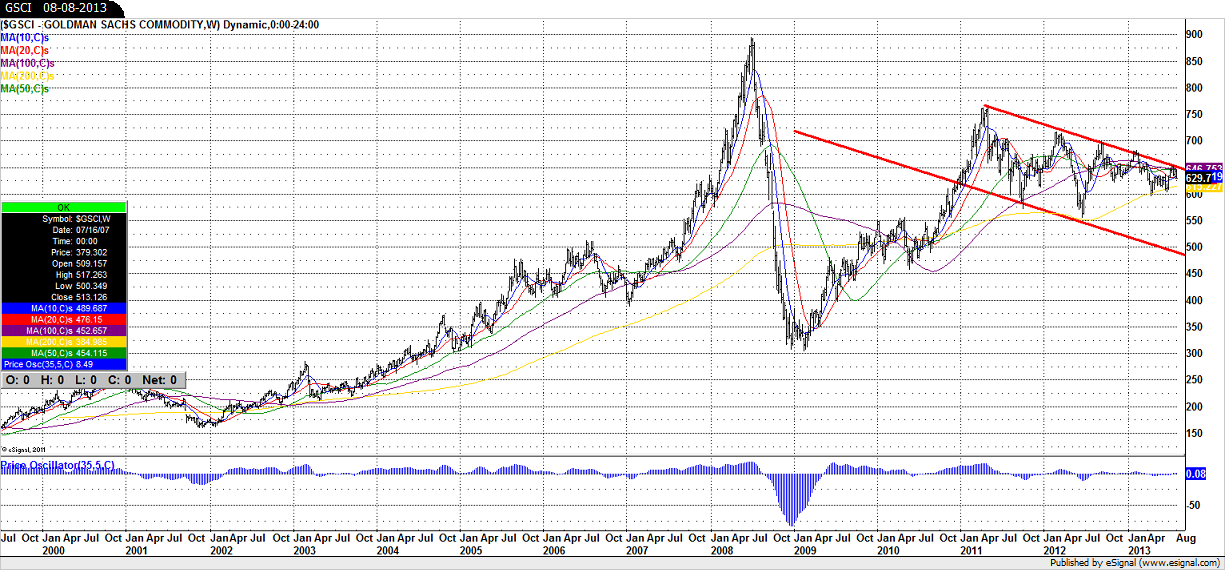
Disclaimers And Disclosures: Registered Representative, Securities offered through Cambridge Investment Research, Inc., a Broker/Dealer, Member FINRA/SIPC. Investment Advisor Representative, Cambridge Investment Research Advisors, Inc., a Registered Investment Advisor. Preferred Planning Concepts, LLC & Cambridge are not affiliated.
©2012, Dominic Cimino of Preferred Planning Concepts, LLC (You can explore the services offered by Preferred Concepts by viewing us on our website at www.ppcplanning.com ) Any redistribution, reprinting, or reference to this chart or content is allowed as long as reference to the author and source is acknowledged.
Please be aware that this is not a recommendation to purchase or sell any security. This is not a recommendation for any individual or institution to alter their portfolio holdings. Every individual or institution has its own risk tolerance and investment objectives and perspectives.
Any above opinions of the author should be viewed as such. These opinions in no way represent any type of guarantee. The above opinions are meant to stimulate thought and should be viewed as such. You are encouraged to discuss these views with your representatives if you have any questions or concerns.
Realize that if you choose to invest in securities, investing in securities carries with it uncertainty and the risk of loss of principal. Lost investment opportunity is also a possibility. Investing in securities carries no guarantees, and past performance is no guarantee of future results. The price movements within capital markets cannot be guaranteed and always remain uncertain.
Any indices mentioned are unmanaged and cannot be invested in directly.
It must here be mentioned that technical analysis offers no guarantees of future price movements. Technical analysis represents an observation of past performance and trend, and past performance and trend are no guarantee of future performance, price or trend. The price movements within capital markets cannot be guaranteed and always remain uncertain.
Neither Cambridge Investment Research nor Preferred Planning Concepts is responsible for the accuracy of content provided by third parties. All material presented herein is believed to be reliable but we cannot attest its accuracy.
Any charts presented were made available by eSignal, a charting service available to individuals or professionals. Anyone interested in exploring the potentials of eSignal should give them a call.
- English (UK)
- English (India)
- English (Canada)
- English (Australia)
- English (South Africa)
- English (Philippines)
- English (Nigeria)
- Deutsch
- Español (España)
- Español (México)
- Français
- Italiano
- Nederlands
- Polski
- Português (Portugal)
- Português (Brasil)
- Русский
- Türkçe
- العربية
- Ελληνικά
- Svenska
- Suomi
- עברית
- 日本語
- 한국어
- 简体中文
- 繁體中文
- Bahasa Indonesia
- Bahasa Melayu
- ไทย
- Tiếng Việt
- हिंदी
Charts Indicate No Inflation Yet
Latest comments
Loading next article…
Install Our App
Risk Disclosure: Trading in financial instruments and/or cryptocurrencies involves high risks including the risk of losing some, or all, of your investment amount, and may not be suitable for all investors. Prices of cryptocurrencies are extremely volatile and may be affected by external factors such as financial, regulatory or political events. Trading on margin increases the financial risks.
Before deciding to trade in financial instrument or cryptocurrencies you should be fully informed of the risks and costs associated with trading the financial markets, carefully consider your investment objectives, level of experience, and risk appetite, and seek professional advice where needed.
Fusion Media would like to remind you that the data contained in this website is not necessarily real-time nor accurate. The data and prices on the website are not necessarily provided by any market or exchange, but may be provided by market makers, and so prices may not be accurate and may differ from the actual price at any given market, meaning prices are indicative and not appropriate for trading purposes. Fusion Media and any provider of the data contained in this website will not accept liability for any loss or damage as a result of your trading, or your reliance on the information contained within this website.
It is prohibited to use, store, reproduce, display, modify, transmit or distribute the data contained in this website without the explicit prior written permission of Fusion Media and/or the data provider. All intellectual property rights are reserved by the providers and/or the exchange providing the data contained in this website.
Fusion Media may be compensated by the advertisers that appear on the website, based on your interaction with the advertisements or advertisers.
© 2007-2025 - Fusion Media Limited. All Rights Reserved.