
The Federal Reserve is suggesting that barring a deterioration of economic activity in the coming months, it is preparing a protracted exit to the extraordinary monetary policy pursued since the credit cycle ended. Talking about it is part of the Fed's forward guidance and is also part of the exit strategy. Investors, both retail and institutional, are adjusting their positions accordingly.
This Great Graphic was published on FT Alphaville, which in turn got them from Credit Suisse. The first chart below tracks the flow of funds into three broad categories of mutual funds. The dark red bar is the flows into, and now out, of bond funds. The dark blue bar are the flows into/out of US equity funds. The light blue, (look closely) track the global equity funds. Roughly $60 bln has left the fixed income funds, apparently the most on record.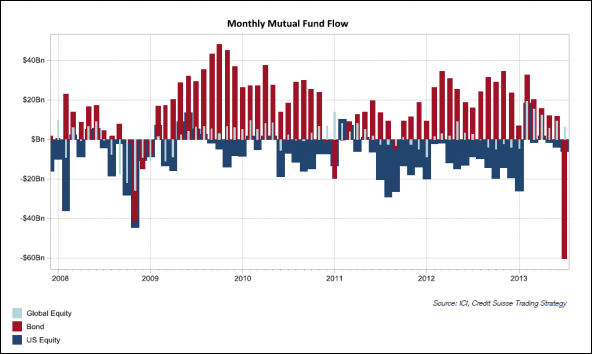
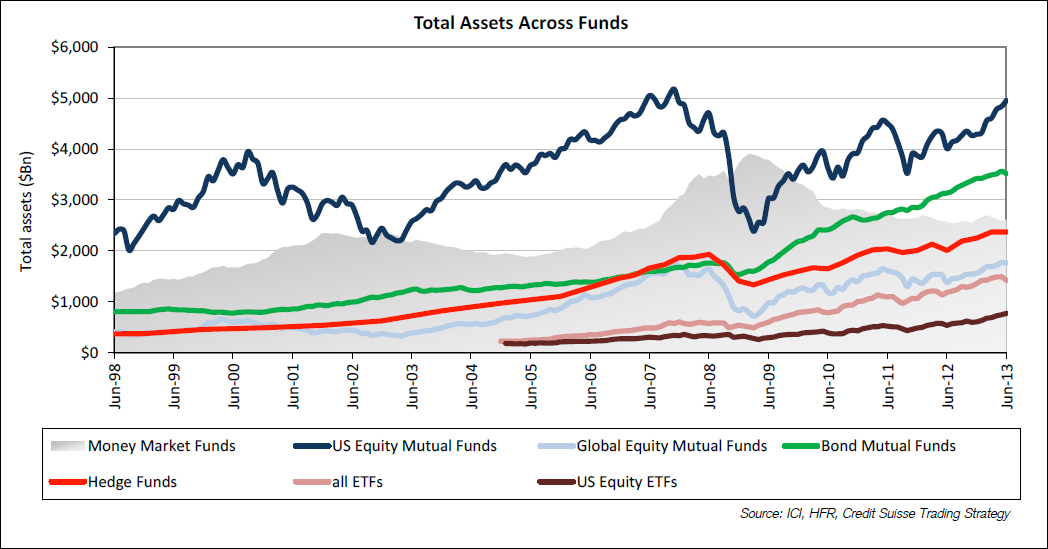
This has been represented in the popular and business press, but the second chart puts it in a larger context of the stock of investments that have accumulated in various investment vehicles since the late 1990s. For example, the green line, which tracks flows into bond mutual funds, shows that the stock of such investment is near $3.5 trillion. On the eve of the Lehman debacle, there was around $1.7 trillion under management by fixed income mutual funds. There is no compelling reason to think that there is a mean reversion process at work and all the funds that flowed into the bond funds will now flow out.
In addition, the bond mutual funds capture mostly retail interest. Institutional investors have also been selling fixed income We noted that Japanese investors, for example, have been significant sellers of foreign bonds this year and in May appear to have sold about $30 bln of US Treasury bonds and notes. We also know that the Fed's custody holdings of Treasuries has fallen by about $26 bln from late May through early July.
- English (UK)
- English (India)
- English (Canada)
- English (Australia)
- English (South Africa)
- English (Philippines)
- English (Nigeria)
- Deutsch
- Español (España)
- Español (México)
- Français
- Italiano
- Nederlands
- Português (Portugal)
- Polski
- Português (Brasil)
- Русский
- Türkçe
- العربية
- Ελληνικά
- Svenska
- Suomi
- עברית
- 日本語
- 한국어
- 简体中文
- 繁體中文
- Bahasa Indonesia
- Bahasa Melayu
- ไทย
- Tiếng Việt
- हिंदी
Charting Investment Flows
Latest comments
Loading next article…
Install Our App
Risk Disclosure: Trading in financial instruments and/or cryptocurrencies involves high risks including the risk of losing some, or all, of your investment amount, and may not be suitable for all investors. Prices of cryptocurrencies are extremely volatile and may be affected by external factors such as financial, regulatory or political events. Trading on margin increases the financial risks.
Before deciding to trade in financial instrument or cryptocurrencies you should be fully informed of the risks and costs associated with trading the financial markets, carefully consider your investment objectives, level of experience, and risk appetite, and seek professional advice where needed.
Fusion Media would like to remind you that the data contained in this website is not necessarily real-time nor accurate. The data and prices on the website are not necessarily provided by any market or exchange, but may be provided by market makers, and so prices may not be accurate and may differ from the actual price at any given market, meaning prices are indicative and not appropriate for trading purposes. Fusion Media and any provider of the data contained in this website will not accept liability for any loss or damage as a result of your trading, or your reliance on the information contained within this website.
It is prohibited to use, store, reproduce, display, modify, transmit or distribute the data contained in this website without the explicit prior written permission of Fusion Media and/or the data provider. All intellectual property rights are reserved by the providers and/or the exchange providing the data contained in this website.
Fusion Media may be compensated by the advertisers that appear on the website, based on your interaction with the advertisements or advertisers.
© 2007-2025 - Fusion Media Limited. All Rights Reserved.