With the June Fed meeting just around the corner, the market is waiting with bated breath for its decision on Quantitative Easing 3. It's like a bad movie where they keep making sequels nobody wants to watch, but are forced to endure.
The economic picture will dictate the central-bank's actions in June. With that in mind, let's take a peek at a few charts showing just where we stand.
Production Indexes
Production numbers in the economy often lead the stock indicators. The aftershock of slowing orders affects revenues reported at the end of the period, and the stock price eventually reacts as information leaks into the market.These three charts are good indicators of the direction of the U.S. economy.
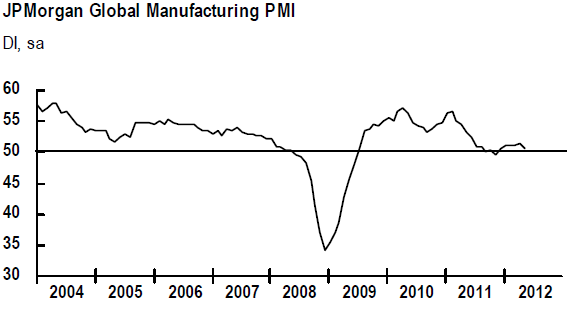
PMI Manufacturing is a global measure published by JP Morgan. The chart shows a steady decline to the 50 range. The trend is bearish, and prints below 50 is a direct indicator of slow down. The economy bounced off the line, had a tepid rebound and is angling down again.
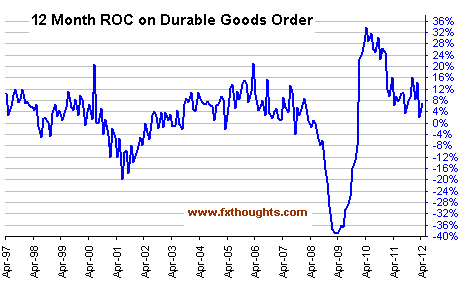
Durable goods are also sharply trending down. They tried to rebound in 2011 but appear to be losing steam. People are buying fewer computers, household goods and cars and may be stretching what little cash they have.
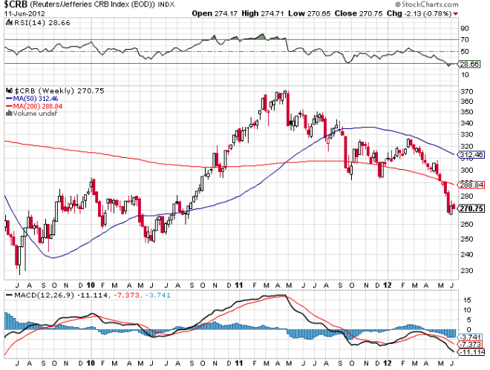
The CRB index is a broad measure of commodity prices. Falling values indicate less demand, which points to cooling production. The following weekly chart gives us a good two-year view. Again, 2012 trends are down while showing lower highs and lower lows.
Growth Indexes
Wouldn't you know it, but growth is also trending down. Without growth, how do we pay our public debt and increase our lifestyles? The answer is, you can't. Paying attention to growth is as important as planning your personal finances. If the total pie is shrinking, you should know by how much it will affect your personal finances.
The Economic Cycle Research Institute publishes a weekly leading index that happens to have a high correlation with Gross Domestic Product and recessions. If you guessed it was trending down, you're correct. The index has created a new trough after failing to hold the previous high resulting after the market crash.
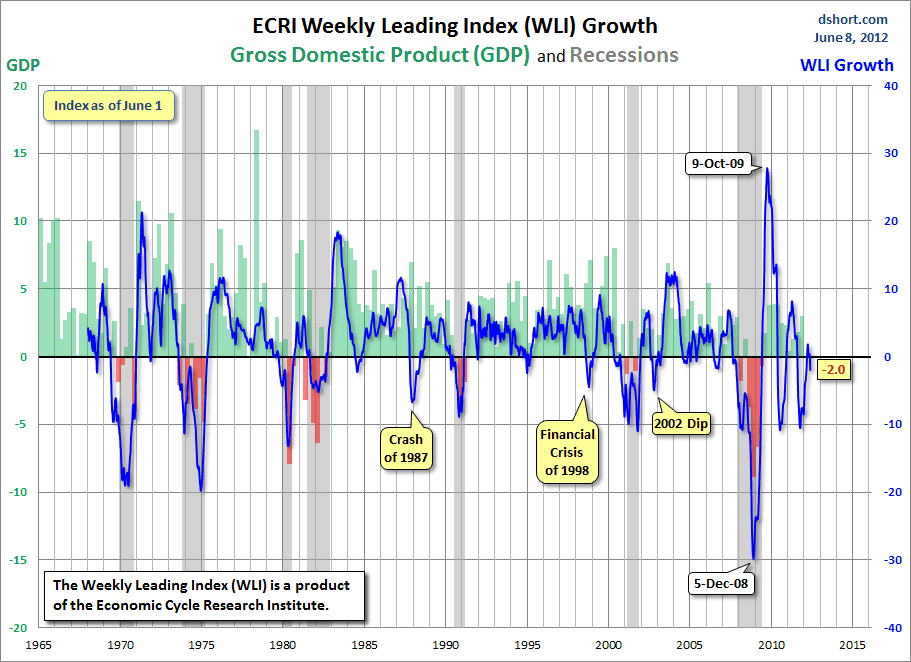
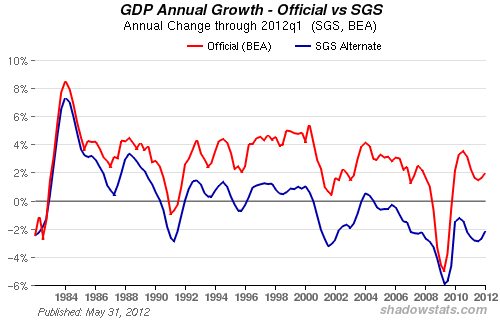
What about GDP? Well, as the ECRI index has predicted, GDP is also faltering at a time in which the U.S. desperately needs it to climb out of the current financial morass. The real, non-manipulated GDP figure never went positive after Lehman -- even after the trillions printed by the central bank. GDP has quite a way to go to reach zero and advance firmly into positive territory. This means the so-called recovery championed by the mainstream press was but a child's fable. In fact, GDP hasn't formally recovered since technology tanked.
Transportation Indexes
What about trade? If we are still moving goods, surely that's a sign of a firm economy.
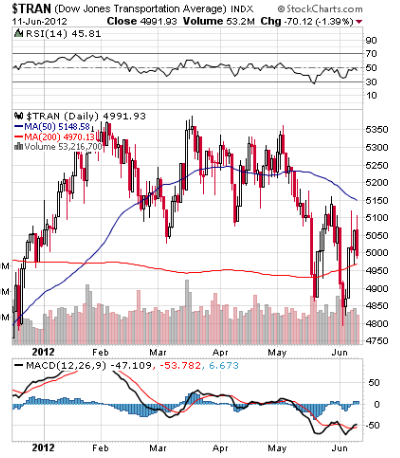
The Dow Jones Transportation Average has been crashing. The most recent activity suggests the average will firmly test the 200-day moving average to the downside.
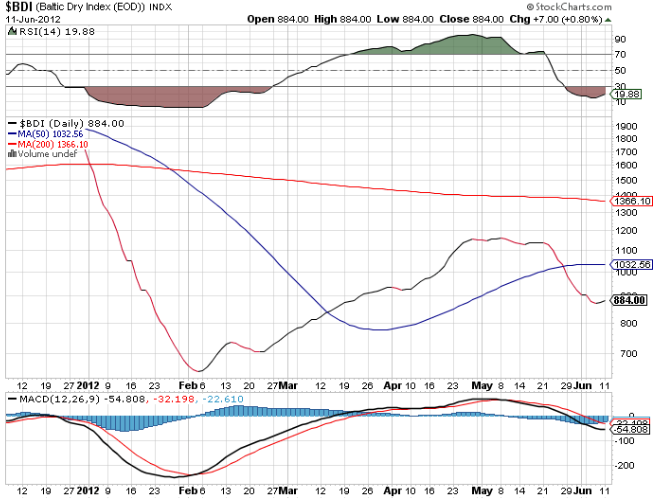
The Baltic Dry Index is an assessment of the prices for moving raw materials across shipping channels. If prices are falling, that generally signals weak demand for overseas transportation and, hence, trade. The index is currently on life support after a spring romp failed to take out the 200-day moving average. The 50-day moving average has also been breached to the downside.
Stock Indexes
Ok, what about stocks? Strong performance may signal strong investor confidence in the economy. It may portend the benefits of cost cutting in increased margins.
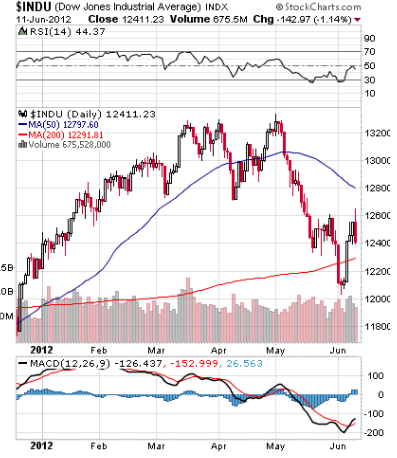
The Dow Jones Industrial Average officially went on life support in May. It staged a weak rally in June. The sharpness of current bearish movement suggests a continuation of the overall downward trend.
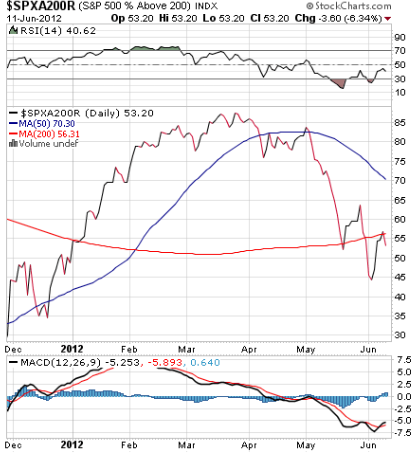
The S&P 500 index has not fared much better. After a similar May swoon, the S&P tested the 200-day moving average, then thought better of it.
Consumers Go On Credit Binge
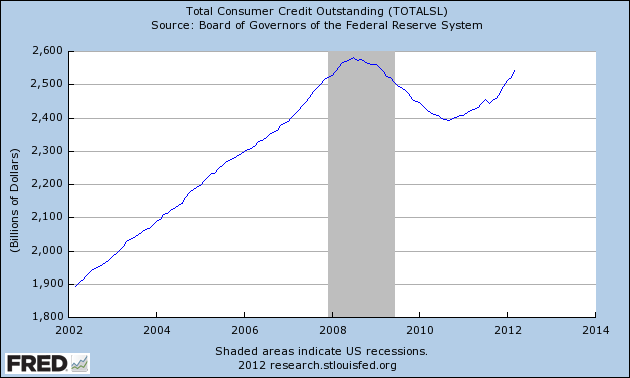
Retail sales reports are up sharply. So does this mean consumers are confident? Apparently -- not learning from recent history -- consumers have once again been gobbling up credit. Since durable goods purchases are down, real estate is down and retail stock market participation is weak, people are spending their money on other things like milk and butter. And they're doing it on credit. That is not a bullish sign for the economy. Without proper savings, investment will suffer and so too will growth.
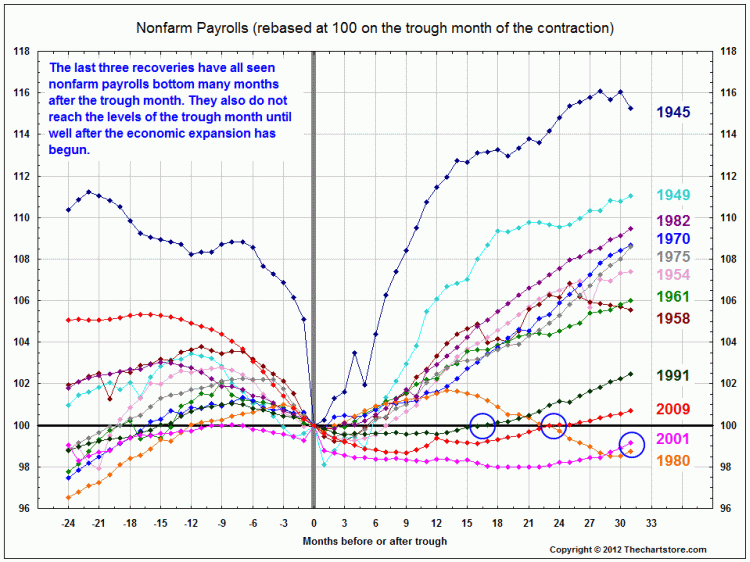
The following employment graph adds the final touches to the faltering economic picture. Compared with recoveries of previous recessions, jobs are nowhere near where they need to be. This explains a lot about the use of credit to purchase non-durable goods.
To QE Or Not To QE, That Is THE Question
Will 'Bernank' fire up the printing presses one more time in a bid to prop the faltering economy, or will he leave every portfolio manager, day trader and high-frequency computer algorithm hanging? The atmosphere is pretty tense, and here's why: these 11 charts show the economy is crashing. But is it enough to persuade Benjamin to start the presses?
I think with the election hovering in the not-too-distant future -- and the Fed never failing a sitting president -- we can expect an announcement on QE this year. But I don't think it will be in June.
Even though it takes several months for fresh greenbacks to work their way through the economy, the expectation of QE is almost more important than the money injection itself. If Bernanke fires his cannon too early, it may miss the target and ruin Obama's chances. I look for QE to happen in August or September, about the right time to keep the people's minds off of the economy and on the political race.
The economic picture will dictate the central-bank's actions in June. With that in mind, let's take a peek at a few charts showing just where we stand.
Production Indexes
Production numbers in the economy often lead the stock indicators. The aftershock of slowing orders affects revenues reported at the end of the period, and the stock price eventually reacts as information leaks into the market.These three charts are good indicators of the direction of the U.S. economy.
PMI Manufacturing is a global measure published by JP Morgan. The chart shows a steady decline to the 50 range. The trend is bearish, and prints below 50 is a direct indicator of slow down. The economy bounced off the line, had a tepid rebound and is angling down again.

Durable goods are also sharply trending down. They tried to rebound in 2011 but appear to be losing steam. People are buying fewer computers, household goods and cars and may be stretching what little cash they have.

The CRB index is a broad measure of commodity prices. Falling values indicate less demand, which points to cooling production. The following weekly chart gives us a good two-year view. Again, 2012 trends are down while showing lower highs and lower lows.

Growth Indexes
Wouldn't you know it, but growth is also trending down. Without growth, how do we pay our public debt and increase our lifestyles? The answer is, you can't. Paying attention to growth is as important as planning your personal finances. If the total pie is shrinking, you should know by how much it will affect your personal finances.
The Economic Cycle Research Institute publishes a weekly leading index that happens to have a high correlation with Gross Domestic Product and recessions. If you guessed it was trending down, you're correct. The index has created a new trough after failing to hold the previous high resulting after the market crash.

What about GDP? Well, as the ECRI index has predicted, GDP is also faltering at a time in which the U.S. desperately needs it to climb out of the current financial morass. The real, non-manipulated GDP figure never went positive after Lehman -- even after the trillions printed by the central bank. GDP has quite a way to go to reach zero and advance firmly into positive territory. This means the so-called recovery championed by the mainstream press was but a child's fable. In fact, GDP hasn't formally recovered since technology tanked.

Transportation Indexes
What about trade? If we are still moving goods, surely that's a sign of a firm economy.
The Dow Jones Transportation Average has been crashing. The most recent activity suggests the average will firmly test the 200-day moving average to the downside.

The Baltic Dry Index is an assessment of the prices for moving raw materials across shipping channels. If prices are falling, that generally signals weak demand for overseas transportation and, hence, trade. The index is currently on life support after a spring romp failed to take out the 200-day moving average. The 50-day moving average has also been breached to the downside.

Stock Indexes
Ok, what about stocks? Strong performance may signal strong investor confidence in the economy. It may portend the benefits of cost cutting in increased margins.
The Dow Jones Industrial Average officially went on life support in May. It staged a weak rally in June. The sharpness of current bearish movement suggests a continuation of the overall downward trend.

The S&P 500 index has not fared much better. After a similar May swoon, the S&P tested the 200-day moving average, then thought better of it.

Consumers Go On Credit Binge
Retail sales reports are up sharply. So does this mean consumers are confident? Apparently -- not learning from recent history -- consumers have once again been gobbling up credit. Since durable goods purchases are down, real estate is down and retail stock market participation is weak, people are spending their money on other things like milk and butter. And they're doing it on credit. That is not a bullish sign for the economy. Without proper savings, investment will suffer and so too will growth.

The following employment graph adds the final touches to the faltering economic picture. Compared with recoveries of previous recessions, jobs are nowhere near where they need to be. This explains a lot about the use of credit to purchase non-durable goods.

To QE Or Not To QE, That Is THE Question
Will 'Bernank' fire up the printing presses one more time in a bid to prop the faltering economy, or will he leave every portfolio manager, day trader and high-frequency computer algorithm hanging? The atmosphere is pretty tense, and here's why: these 11 charts show the economy is crashing. But is it enough to persuade Benjamin to start the presses?
I think with the election hovering in the not-too-distant future -- and the Fed never failing a sitting president -- we can expect an announcement on QE this year. But I don't think it will be in June.
Even though it takes several months for fresh greenbacks to work their way through the economy, the expectation of QE is almost more important than the money injection itself. If Bernanke fires his cannon too early, it may miss the target and ruin Obama's chances. I look for QE to happen in August or September, about the right time to keep the people's minds off of the economy and on the political race.
