Last week’s Chart of the Week kicks off this week’s, though it will have to wait for a series of explanations to get us from that one to this. A week ago, we noted the growing divergence between leveraged loan prices and WTI, two risk indicators that used to be pretty well correlated for obvious reasons. The S&P/LSTA Leveraged Loan 100 Index did not have a good week this week, while oil was down only somewhat until trading on Friday.
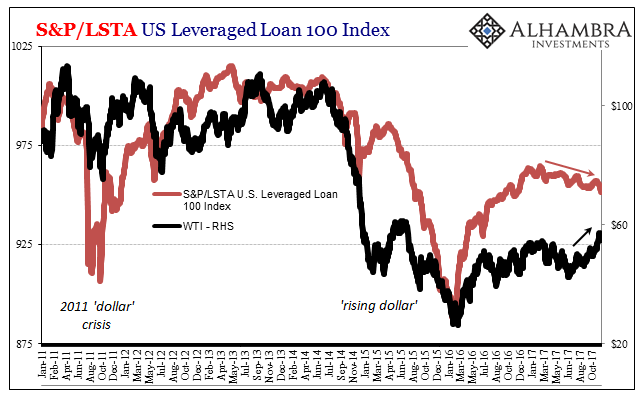
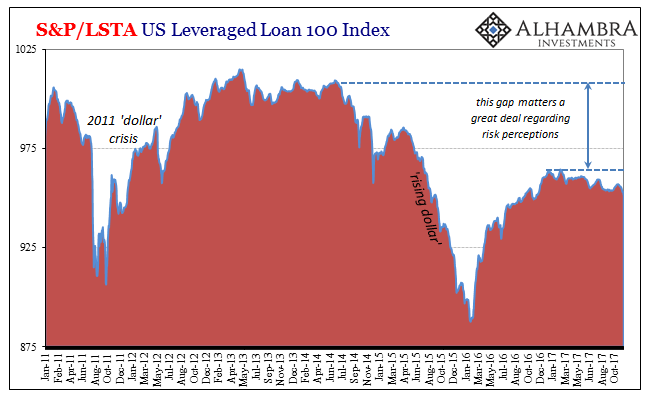
In broader terms, it’s an indication of latent risk being traded in systemic fashion. This extends, of course, beyond US junk credit and oil into currencies like CNY, HKD, RUB, and BRL; i.e., the eurodollar system. It’s the last one that is of interest today and produces our Chart of the Week (at the bottom).
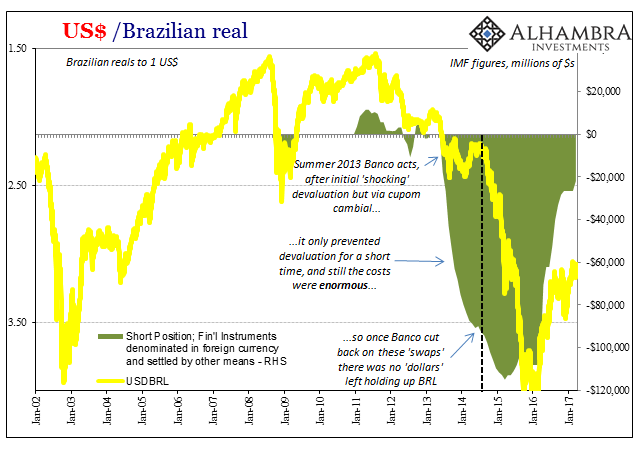
To review recent history for Brazil first as a way of background for it, Banco do Brasil in the radical summer of taper in 2013 began auctioning off swaps as a defensive measure. The real had been under pressure since the end of July 2011 (an especially noteworthy time period), but had appeared to stabilize through 2012 until Bernanke said that magic word the following year.
Dumping to around 2.50 to the dollar, a low almost as bad as Brazil’s worst during the crisis in 2008, the swap regime seemed appropriate. These were not really dollar swaps, though, rather they were more complicated instruments that interfered with the cost of Brazilian banks obtaining “dollars” on global markets (a subsidy). I wrote a short description of this cupom cambial process in October 2013, just a few months after having declared Brazil already toast for doing this very thing.
The way the Brazilian derivatives market works is different than what is implied in mainstream commentary. Without getting too far into those weeds, the Brazilian monetary authorities realized, from past experience with currency depreciation-type emergencies, that they did not necessarily need to offer dollars. Instead, the Brazilian treasury sells, continuously, domestic public debt indexed to US dollar rates.
The Banco’s “swaps”, then, act only on implied future dollar rates, increasing the cupom cambial (the onshore dollar rate implied by currency futures and spreads with dollar rates). In other words, since the central bank “swap” reduces the futures price of dollars in relative comparison to the spot price, there is a greater incentive for banks (both Brazilian and foreign) to borrow US dollars on foreign markets and import them to take advantage of the cupom cambial spread. The swap isn’t really a swap in the conventional sense since the central bank is only swapping dollar indexed securities – deliverable in reals.
This is why on the IMF call sheets these “swaps” show up in the memorandum items as “Short Position; Financial Instruments Denominated in Foreign Currency and Settled by Other Means.” The reason I believed Brazil was toast was because, as noted in the passage above, Banco was getting local Brazilian banks to go further short the “dollar” just as an enormous short squeeze (the roots of the “rising dollar”) was taking hold. That was apparent to me in 2013 in proportions that were eventually dwarfed by the real action later in 2014.
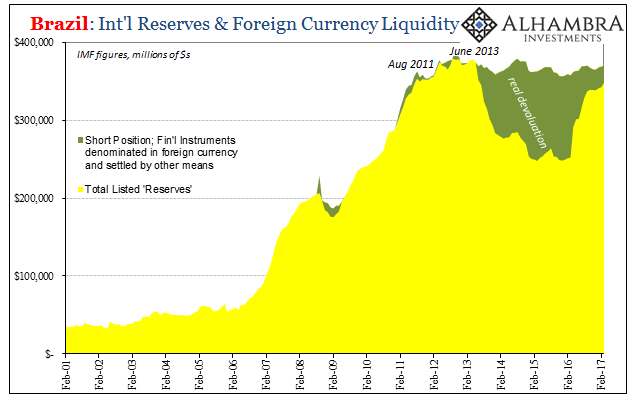
By September 2014, Banco had wound up its short position to almost one-quarter of all its listed reserves. From the perspective of the central bank handbook, this is what you do because even at great cost like that the manual says you need only buy some time. In Brazil’s case, the central bank intervention bought about a year.
At that point Banco started scaling back their swap operations and the bottom completely dropped out of the real.
Things started to reverse again in March 2016. Brazil including Petrobras was able to secure dollar financing via Eurobonds as well as swaps with other countries (China), and with a rising real Banco further wound down though not completely their prior (failed) intervention. Yet, BRL is, like oil and US$ junk credit, nowhere near retracing the “rising dollar” devastation.
Why? The Chart of the Week, updated TIC, gives us one big part of the answer.
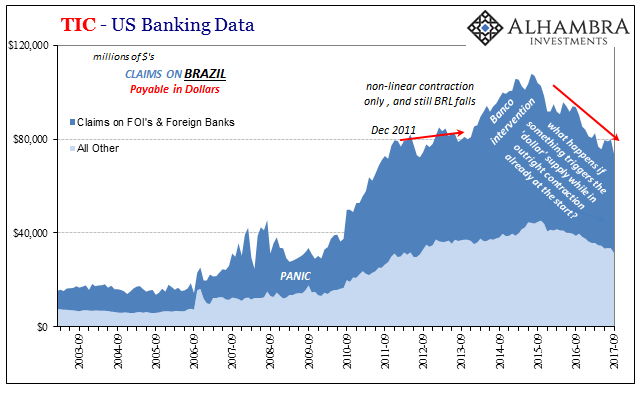
Look at the TIC US Bank data like Brazil’s “dollar” baseline. At first it doesn’t appear to have been all that bad from 2011 to the middle of 2013, and still BRL was hit pretty hard. Non-linear contraction isn’t just mathematics. Since Banco’s intervention ended, Brazil’s “dollar” baseline has shrunk back to less than what it was in 2011 the last time BRL was pushing 1.50, not stuck at 3.20. And it still actively declining.
The difference is pure liquidity risk. Right now BRL is gently declining but only because right at this moment the global “dollar” condition isn’t actively destructive. It’s not quite benign, but it’s not falling apart like 2014-16, either.
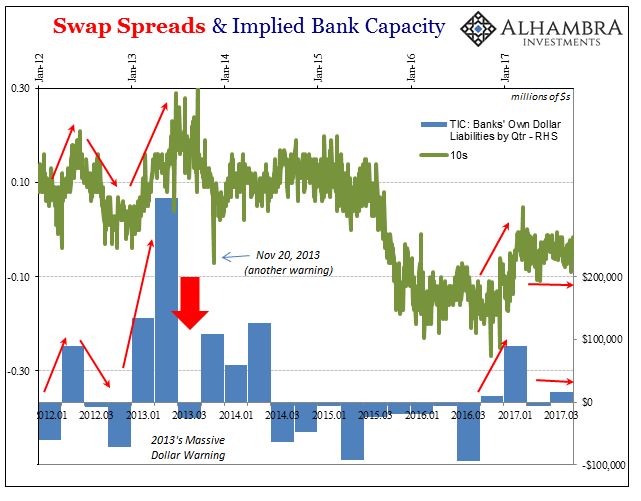
If, however, the “dollar” supply was to shift more problematic, Brazil has no cushion with which to absorb that hit. Would another “swaps” intervention even have much effect? I would hope not, expecting that Brazilian banks would have learned at least something from the 2013-14 experience.
In other words, Brazil is hugely exposed to the eurodollar, still, even more so (linear contraction in “dollar” funding over the past two years as compared to at least stable funding balances after 2011) than it was when all the shooting started four years ago.
This problematic state obviously applies to more than just Brazil and reals. Thus, price rebounds in a lot of places and markets that aren’t really rebounds. Huge downside monetary risks remain, waiting only for the “next one” to trigger them.
