by Pinchas Cohen
On July 12, United Continental Holdings' (NYSE:UAL) shares gapped up, opening 2.35 percent higher than the previous close, and closed higher on the day by 4.7 percent, at $80.53. The surge occurred on the news that the airline's consolidated traffic in terms of revenue per passenger mile rose 3.4 percent, while consolidated capacity rose 5 percent YoY.
The airline also released an upward revision of an important industry metric, passenger unit revenue, which the airline expected would rise 2 percent, meeting the company’s average guidance.
The company's President, Scott Kirby announced:
“Last month’s performance capped off an exceptional first half of our operation, and we look to continue the momentum through the second half of the year and beyond.”
This most recent data led analysts to raise their estimates on the stock, ahead of the company's report, which is scheduled to occur later today. Consensus estimates for earnings were shifted up from $2.47 to $2.71 EPS, vs. $2.61 YoY.
Turning Lemons Into Lemonade
On July 13, the following day, United unveiled its “flex-schedule” program, to deal with overbooking problems, by reselling overbooked passenger seats.
The program is a juicer, meaning it will help the company turn sour lemons into refreshing lemonade. The airline is clearly working on how to solve problems that have been dogging them as well as the industry—bad publicity, four-figure payouts to passengers willing to relinquish their seats at the gate, or being forced to lower their sales—while simultaneously turning a profit.

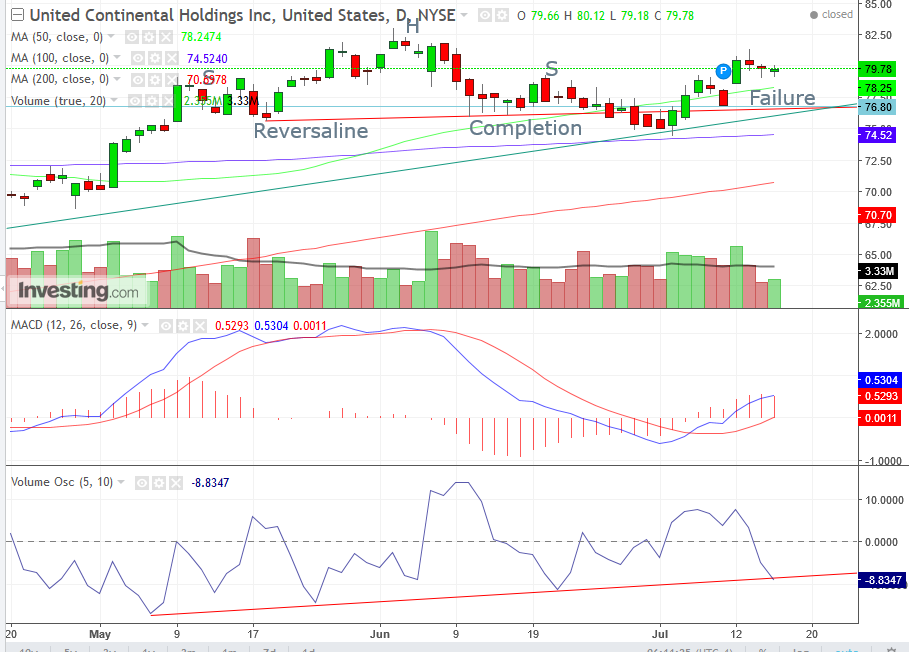
On June 2, the airline’s stock reached an all-time high of $83.04 and $82.03 record close. The much lower close formed a bearish shooting star, which preceded a 10.37 percent decline to the July 5, $74.43 low. The all-time-high shooting star proved to be the head of a H&S top, after the May left shoulder and the June right shoulder.
On June 29, the price completed the pattern when it crossed below its reversal line, at $76.35 per its angle at the time, closing at $75.44. However, its year-long uptrend line and 100 dma (blue) provided it support on July 5, from which point it climbed from the low of $74.43 to the July 13, $81.39 high. In doing so, it crossed back above the H&S neckline, rendering the pattern’s bearish nature a failure, turning it into a bullish consolidating pattern.
Fundamentals and Technicals Don't Align
The initial news, the data upward revision, occurred on July 12, but the stock price had already been climbing since July 5, five sessions earlier. Was that a coincidence, or had “informed money” already acted on it? Note, the bearish H&S top was completed, but the news changed the picture on its head-and-shoulders.
The second piece of news, about the a flex-schedule, was released the following day. But while the stock advanced, it still closed below the previous day's close. It should have been surprising that such promising news—something that had the United executive board estimating how much would be added to the bottom line—would not have helped the stock price at all. Unless, of course, informed money had already driven the stock up before the news became public.
The H&S was real. This can be confirmed with the falling MACD, but more importantly with volume. The formation of the head was accompanied by diminishing volume on the upside and rising volume on the downside, making it clear that participation was on the downside. The formation of the right shoulder was accompanied by diminishing volume on the upside and rising volume on the downside.
Finally, the return above the neckline, which rendered the pattern a failure, was accompanied by rising volume, while the short-term declines within the July 5 to July 13 rally, two red-candle pairs, were accompanied by diminishing volume, suggesting the declines are merely corrections within the rally.
The MACD had been rising from an oversold condition—its shorter MA rising above its longer MA—suggesting recent price data is rising higher than longer price data, providing a buy signal.
The Volume Oscillator confirms the direction of the rising volume. Yesterday, it reached the support of its uptrend line since the H&S formation.
Price has crossed above the 50 dma (green) after the upward data revision on July 12, while the 100 dma (blue) guards the H&S pattern, and the 200 dma (red) is guarding the 2-year uptrend line.
Target Implication
The size of the pattern is $6.50, or 7.85%, though targets are derived based on a point measurement, not a percent. It provides a minimum target price of $89.50 or 7.25%.
Trading Strategies
Conservative traders may wait on a long for overcoming the June 2, $83.04 top resistance, as well as for a downward correction, which should be above the July 5 $74.43 low. This would constitute a viable uptrend. That requires two series of rising peaks and troughs.
Moderate traders would rely upon the pattern failure but may wait for a further correction toward $79 before going long. Alternatively, they could rely on a close above the June 12, $80.53 close – if not a close above the July 13 $81.39 high.
Aggressive traders would go long now, while using the above price levels for stop-losses and limits.
