by Pinchas Cohen
Traders may short iron ore and the Aussie dollar
Moody’s credit rating cut for China put a scare into markets. As the world's second biggest economy – and by far its most aggressive – repercussions may be far reaching. Traders were happy to see that as of this early morning, the risk was localized.
While Chinese shares were down, other Asian markets were up. Europe is currently mixed and fluctuating between reds and greens. But keep an eye on Australian assets.
Australia’s biggest two-way trade partner is China. Its exports to China are valued at $98.2 billion and its imports from China are worth $54.3 billion. This gives Australia a $44 billion positive trade balance with China. Approximately 34% of Australia’s total exports go to China.
The single largest of these exports is iron ore, for business worth $46 billion a year. Australia is also China's second largest overseas investment destination.
According to the Chinese Ministry of Commerce, China's outbound direct investment into Australia in 2016 increased by $3.68 billion USD, a year-on-year increase of 56.1 percent. Since China is the largest buyer of Australian goods and assets—including purchasing the Aussie dollar, to pay for those goods—the AUD took a fall on the expected lower Chinese demand of the currency. Similarly, since the biggest buyer of metals, particularly iron ore, is China, the same thing happened to the base metal's future price.
Clearly, these two assets should be the ideal China-credit-cut trades.

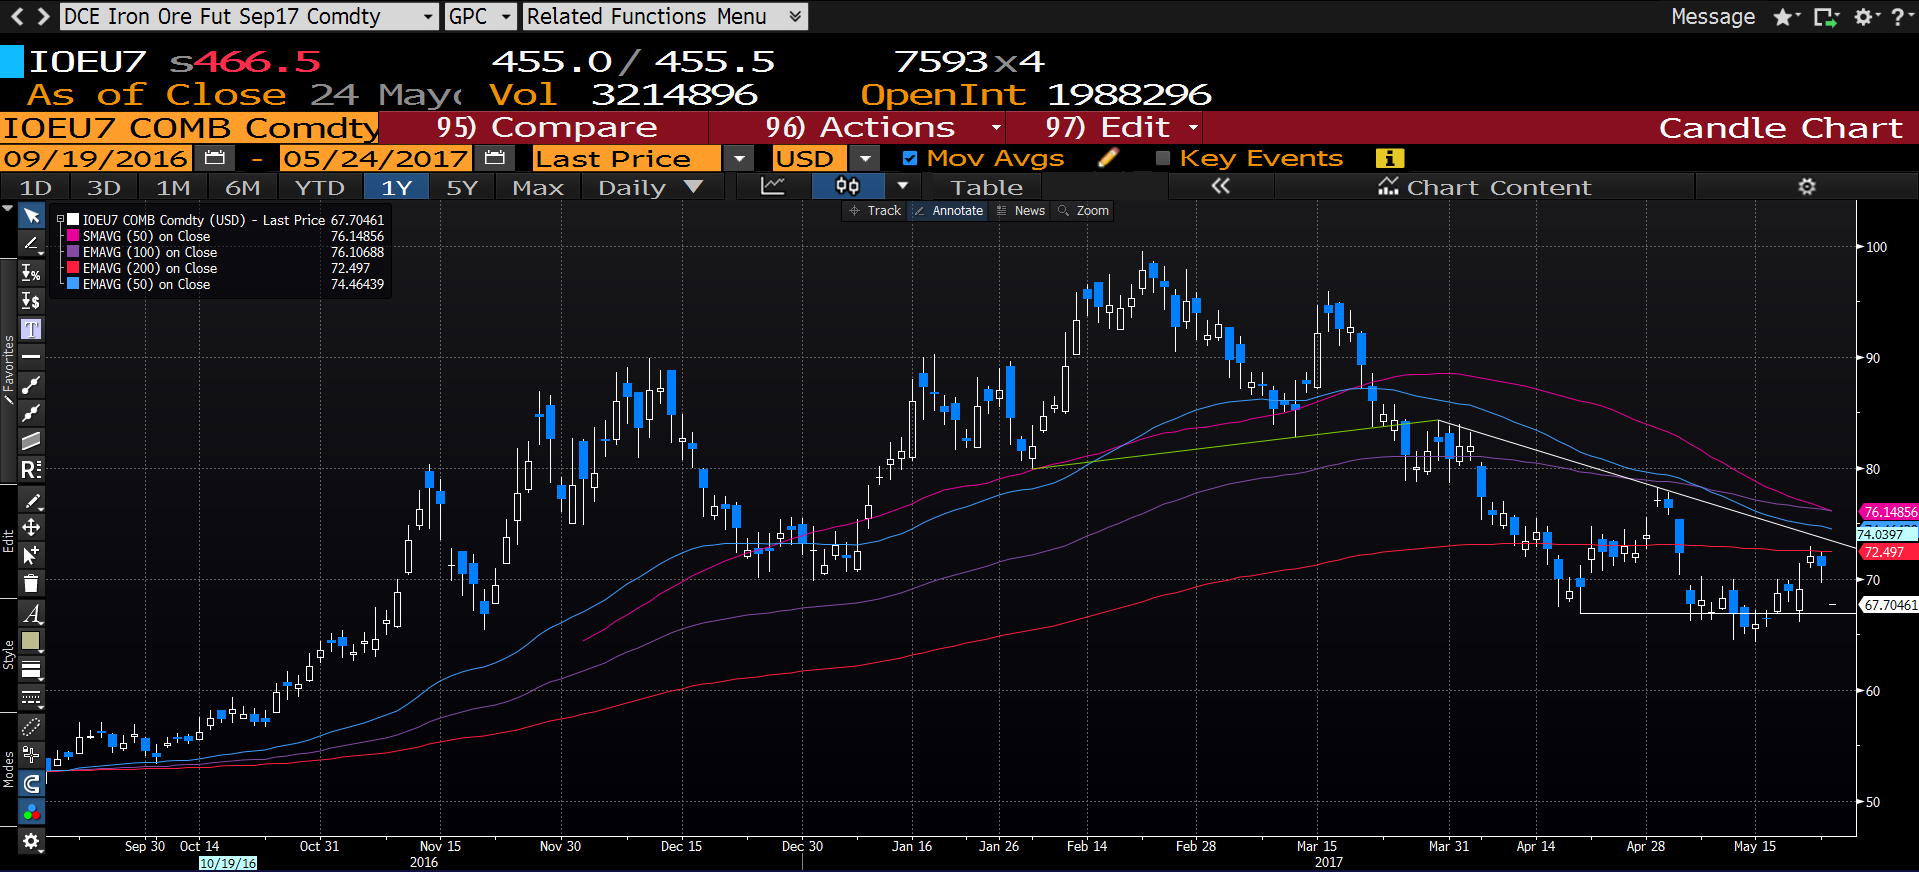
The metal’s price ended its uptrend when it reached its high of $99.52 on February 21. Since then it completed a rising head and shoulders, (H&S), with the 50 day simple ma (pink) as its natural neckline; completed a return move to the drawn neckline; and completed its price target down by $16.80 and then some, with another $1.85 decline. Where will it go next?
The nearly $18.50 decline since the break of the H&S neckline was traded within a Descending Triangle. While buyers are only willing to buy at the same low price of $65/6, sellers are willing to sell at ever lower prices, starting at $83 during late March and early April; then $76/8 in early May; finally, at only the low $70’s during the last two days.
Note above the descending triangle: follow the exponential moving averages: 50 (blue), 100 (purple) and 200 (red).
- The price itself crossed below all of them.
- The 50dma crossed below the 100dma
- At the same time, the 100dma itself is pointing down, which increases the significance of this bearish cross.
- Notice how the 100dma (blue) is retracing the descending slope of the triangle; the location of a moving average is part of its effectiveness.
- Finally, yesterday, the price action had the idea of crossing back above the 200dma (red) but got slapped back down, while forming a bearish Shooting Star, and today’s trading forms a Bearish Engulfing Pattern.
Add all these technical pointers to our earlier fundamental analysis and the future direction for the commodity looks bleak.
Target Price: The height of the triangle is $17.40. Therefore, our target would be $50.00, which is also a psychological support of round numbers, and it could take up to a couple of months to achieve it.
Trading Strategies for Iron Ore:
A conservative trader may wait for a decisive break of the triangle, even a close below the lowest low of trading during this time, which would be on the 15th, with a low of $64.29, while being aware of a possible return move to retest the now-resistance of the triangle, which can push up to $70.
A moderate trader may jump in for a short with a retesting of the roof of the triangle, which at this angle is about at $73; or at least the 200dma (red), at $72.50.
An aggressive trader may short now, counting on the fact that it provides a very attractive risk-reward ratio, being close to the resistance of the triangle top and even 200 dma (red) right above, while being far away from the support of the triangle bottom. It goes without saying that a trader would first calculate the risk of fluctuations and execute money manger accordingly.
AUDUSD Outlook

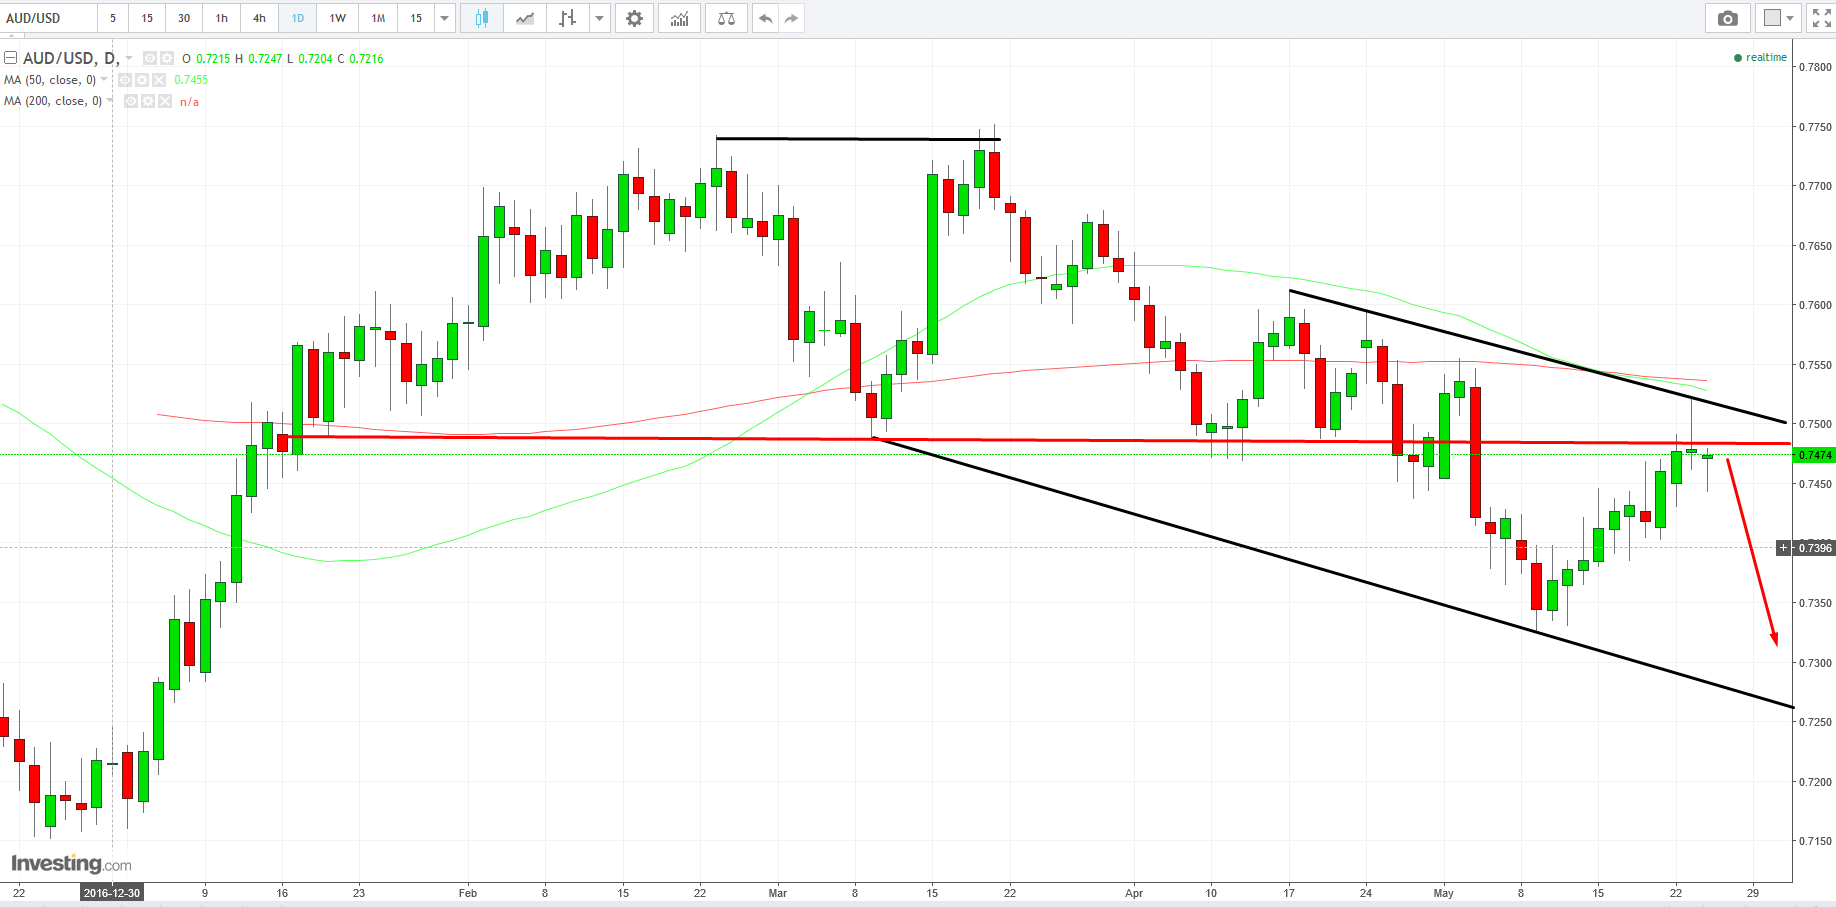
The Aussie dollar too formed a double top, with a high of 0.7750. Still, it took all of April to finally cross below the neckline, at 0.7500, which was also this year’s support.
Yesterday, the price completed a return move, retesting the now-resistance of the neckline, with the high of 0.7517. However, the selling pushed it down to a low close of 0.7477, only one pip higher than its open, forming a bearish Gravestone Doji. The resistance of the neckline is confirmed by the downtrend line since April 15.
Notice the moving averages. The 50dma (green) crossed below the 200dma (red), performing a rare, authentic, significant Dead Cross, which points to the direction of the trend’s momentum. Often, the media and analysts call it a Death Cross, instead of a Dead Cross, using the term when the 50dma crosses below the 200dma, but the 200dma is not falling. This weakens the significance of the cross and according to some authorities renders it moot. Here, both are falling, after the cross.
Target Price: The height of the double top is 250 pips. That provides us with a target price of approximately of 0.7250, if it successfully overcomes the support of the low of May at the price level of 0.7330, which coincides with it being the bottom of the falling channel since the end of March. This price move should take up to three months.
Trading Strategies For AUDUSD
A conservative trader might wait for a return to yesterday’s high of 0.7517, or at least to the neckline at 0.7500.
A moderate trader might wait for a return to today’s resistance, the high of the day of 0.7485.
An aggressive trader would short right now. With so much fundamental pressure and so many technical factors weighing on the price, and rarer still to have fundamentals and technicals so in sync, and rarest of all to have such an attractive risk-reward ratio, coming in at the very top of a falling channel, what could be more optimal?
