by Pinchas Cohen
Many readers are surely disappointed that as of this morning it appears the euro is declining, in the aftermath of the French elections. Wasn't Macron supposed to be good for France and the eurozone? Didn't his election avert another Brexit-like crisis, only it would have been much worse since a Frexit would have torn apart the Union behind the single currency, placing another nail in the euro’s coffin, amidst the eurosceptic mood that's lately gripped much of Europe.
As we discussed earlier today, there is an old Wall Street adage: “buy on the rumor, sell on the news.” What this means is that by the time the news is out, markets have already priced it in.
The euro has been rising since it bottomed, to under 1.0400, with the Italian Referendum in December. Even since its low of April, under 1.0600, the more the media reiterated the impossibility of a La Pen presidential win, the more the euro rose. Now that traders have enjoyed the euro ride, they're ready to take profits—4% since the April Trough and as much as $6.5 since the December bottom.
An additional incentive for savvy investors – those who have the money – is the driving up of the euro in anticipation of Macron’s promised economic reforms, though it's now expected that a divided French parliament may make that a slow and torturous process.
OK, so now what? Is the euro’s upside history? Here’s the honest answer: we don’t know.
But there are some clues available to the single currency's next move, if you know where to look and what to look for.

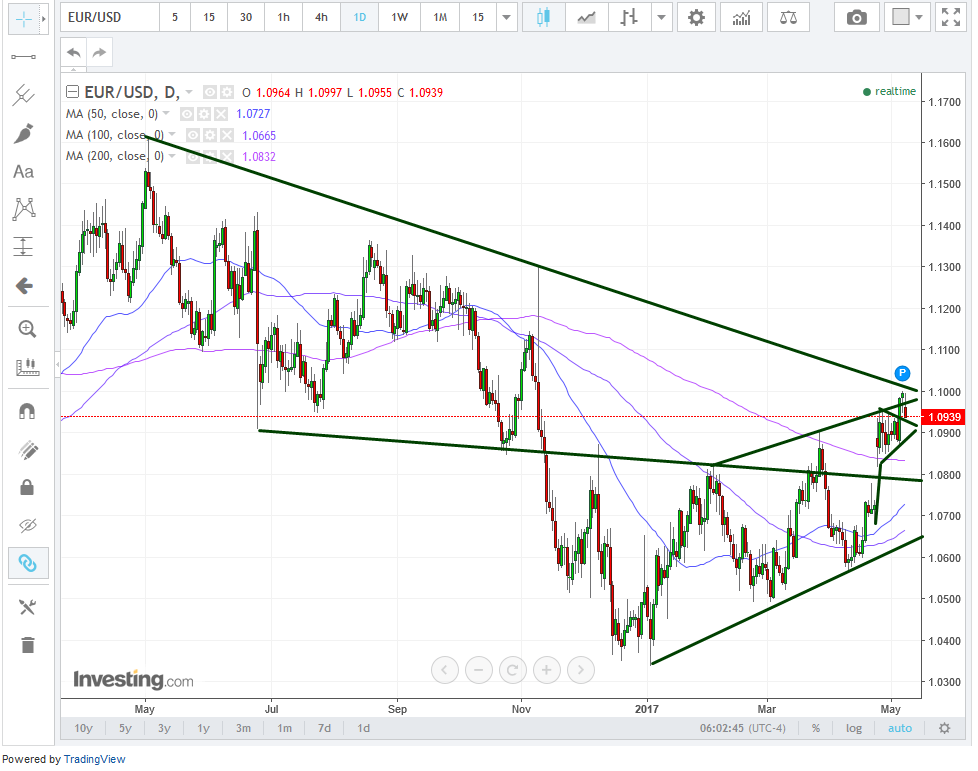
The euro completed an H&S reversal, demonstrating that a new uptrend is rising from the ashes of the old downtrend. The target price implications are minimum 1.1300, which also happens to be the previous peak from November 9, when the Trump Rally took off. A break of that price would introduce a psychological reversal of that rally, but that’s a conversation for another time.
The completion of the current H&S pattern—the upside breakout of its neckline—was done with a rising gap on April 24, reinforcing the meaningful nature of that price level, 1.0800. The fact that the rising gap effortlessly crossed over the 200dma is another confirmation. That the breakout coincided with an upside breakout of the rising channel is yet another confirmation.
Since that leap, and until May 4, the price has been churning. This pattern—a sharp move followed by a rest—is characteristic of a continuation pattern, signaling that traders who invest, who enjoyed the ride are now, 'taking stock,' weighing whether the market has moved too far too fast, or whether this was just another leg within a larger rally.
This particular continuation pattern is called a “pennant,” which is a small triangle. The sharp move out of the pennant on May 4—which also closed at the top of the range, confirming its bullishness—completed the pattern.
Today's decline in the single currency may be nothing more than a return move, to retest the previous-resistance, now-support. From here on it should be smooth sailing in repeating the previous sharp move of 2%. But there is one catch.
Since May 3, 2016, the price has reached its own down trend line, after more than a full year. The day after the pattern breakout, this past Friday, the price rose, but its trading pattern formed a Hanging Man, which has bearish implications, provided the following day’s close is lower.
As of this writing, the euro is at 1.0938, its lowest point of the day. Unless some unexpected good news pops up, it’s likely going to close below where it did during the previous session. Which would then confirm the bearish implications of the Hanging Man, suggesting a further decline.
Note, however, that as of now, the pennant is supporting the price—as it should to a return move, ahead of another leg up. Furthermore, the 50dma is on the rise, after retesting the 100dma on April 19, which is a bullish sign.
Bottom line: the H&S, followed by the pennant, following a rising gap that also effortlessly ran through the 200dma as well as creating an upside breakout of the rising channel, right after the 50dma turns up, subsequent to nearing the 100dma, makes this all very bullish. There's just the small matter of crossing over the year-old down trend line, which hasn't happened yet.
Aggressive traders may buy on today’s dip, ignoring the ominously named Hanging Man and its noose, the year-long down trend line, as they rely upon the support of the tenants. They might focus on the knowledge that a reversal pattern, such as the H&S, by definition means that there was a down trend line preceding it, and take a risk on the statistical chances that, more often than not, the previous down trend line will be crossed. After all, the previous downtrend is over.
Moderately aggressive traders may buy when price returns to the bottom of the pattern or the 200dma below it, or even below that, at the psychological support of 1.0800; or alternatively, if price closes above the Hanging Man, which would coincide with a close over the down trend line.
Conservative traders would buy when price returns to the bottom of the rising channel.
