by Pinchas Cohen
The price of iron ore skyrocketed last year, up 81% to $95 levels on Chinese demand. It reached a two-year high in February.
However, since then it has plunged 32%, to $67 per metric ton levels. That is, until April 20 when it began once again to move up. It has now rebounded 16%, to $77 levels.
Today’s drop of 1.7% has investors wondering whether Chinese demand can support a return to the base metal's February prices or whether China's recent, softer economic data may suggest a regression toward the April 20 low.
Unfortunately for Australia, iron ore doesn't operate on its own. As Australia’s top export it’s a leading indicator for Australia's stock market. Today’s drop in the price of iron ore dragged the country's benchmark stock exchange, the S&P/ASX 200 Index down with it. It's now off 1.15%.
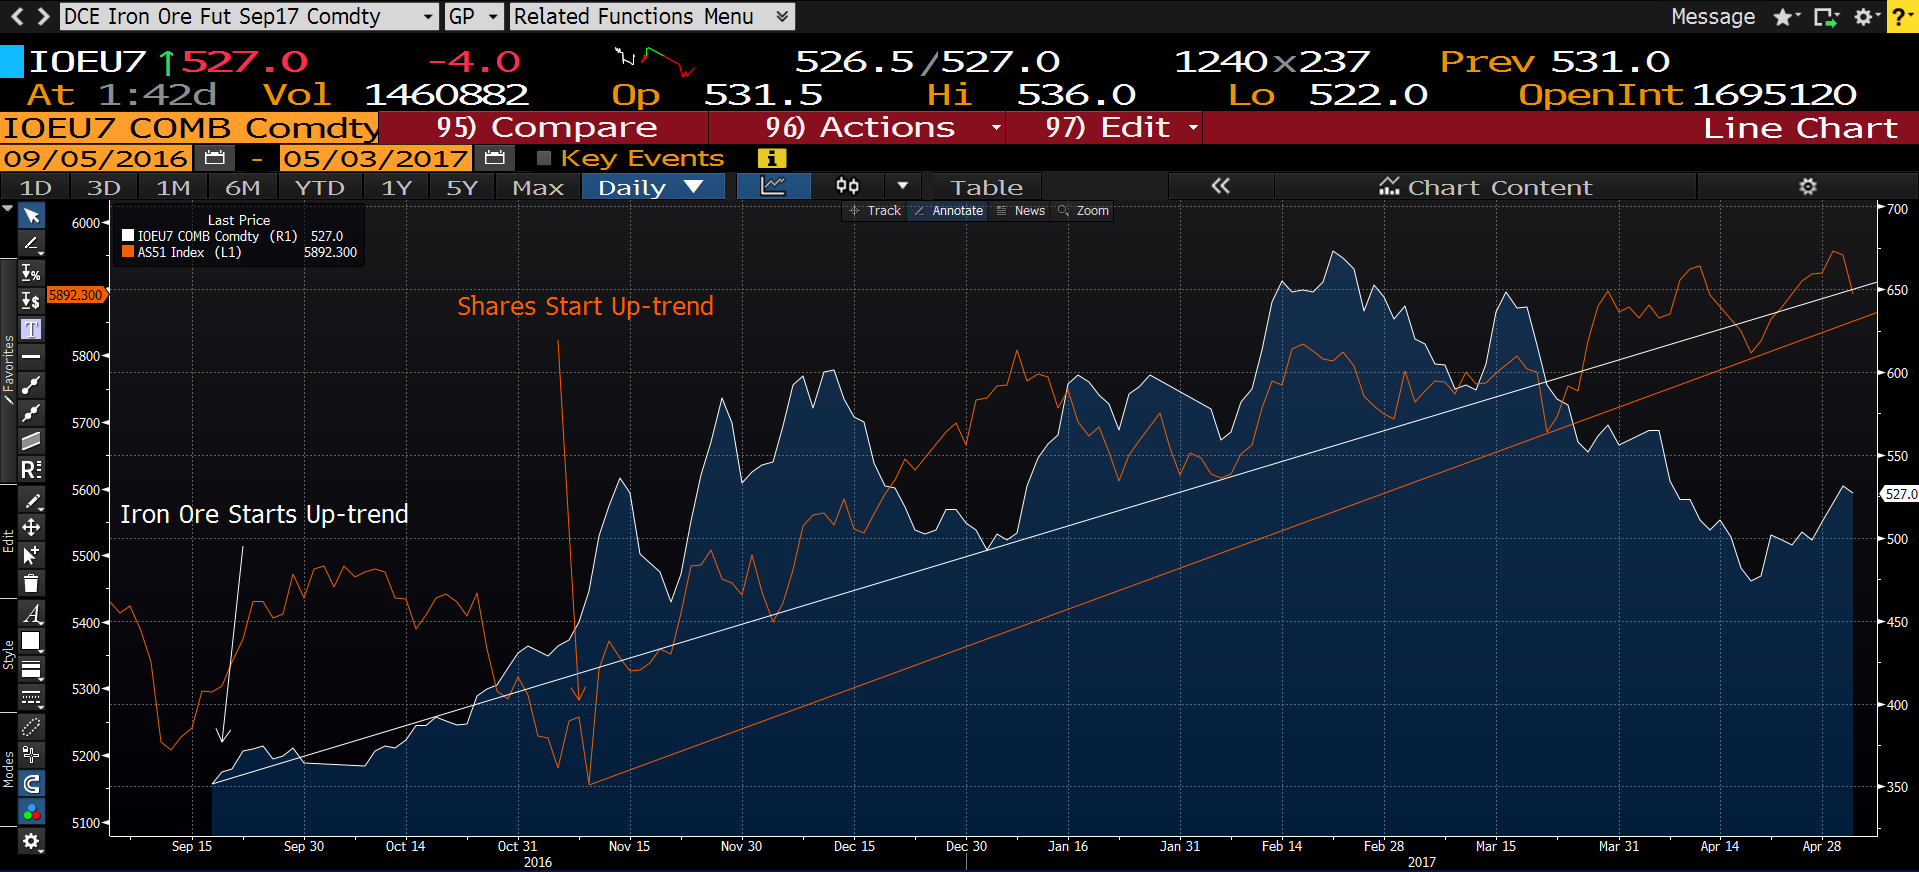
In the chart below you can see the price of iron ore (white line) leads the price of the index. Iron ore began an uptrend in mid-September; the price of the index began an uptrend two months later, in mid-November. In mid-March the price of iron ore fell below that uptrend. Is the index set to follow?

Now let’s analyze the ASX index more closely.

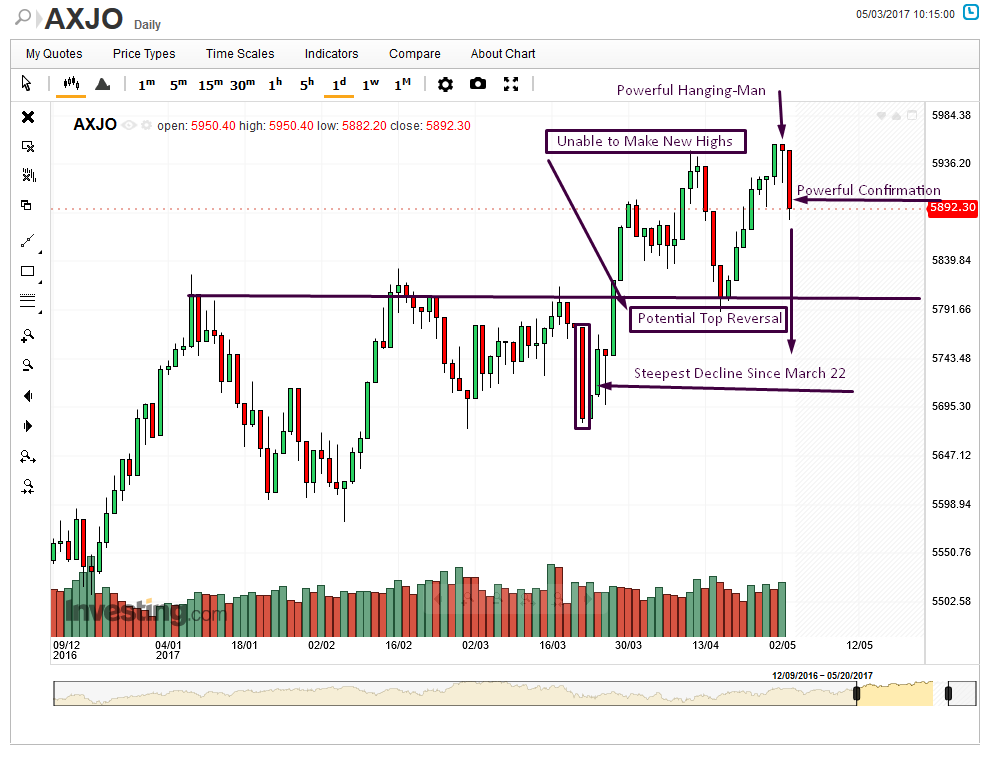
As you can see, yesterday’s trading formed a powerful hanging-man. Its power is measured by the length of the lower shadow relative to the head. The smaller the head and longer the lower shadow, the more powerful the hammer.
However, a hanging man is dependent upon confirmation. That would be a lower close on the following day, and boy did it close lower. Not only did it close lower than the real body of the hanging man, but it closed lower—much lower—than even its lower shadow, which was its intra-day low.
Indeed, it covered four-and-a-half days of gains, which also makes it a powerful Bearish Engulfing Pattern. Another, more important layer in the technical analysis that underlines this pattern's potency is its location. It developed at the price level of the previous peak in early April. This demonstrates that supply awaits at this price level and confirms it.
Note the resistance since the beginning of the year, which became support in early April, at the 5,800 level. That would be its next test.
Should this not hold, it might resume making higher highs. However, if it breaks it will signal a reversal of trend, with an implication of a minimum target price in the 5,600 area, but only after breaking through the support of its previous troughs at 5,680 price levels.
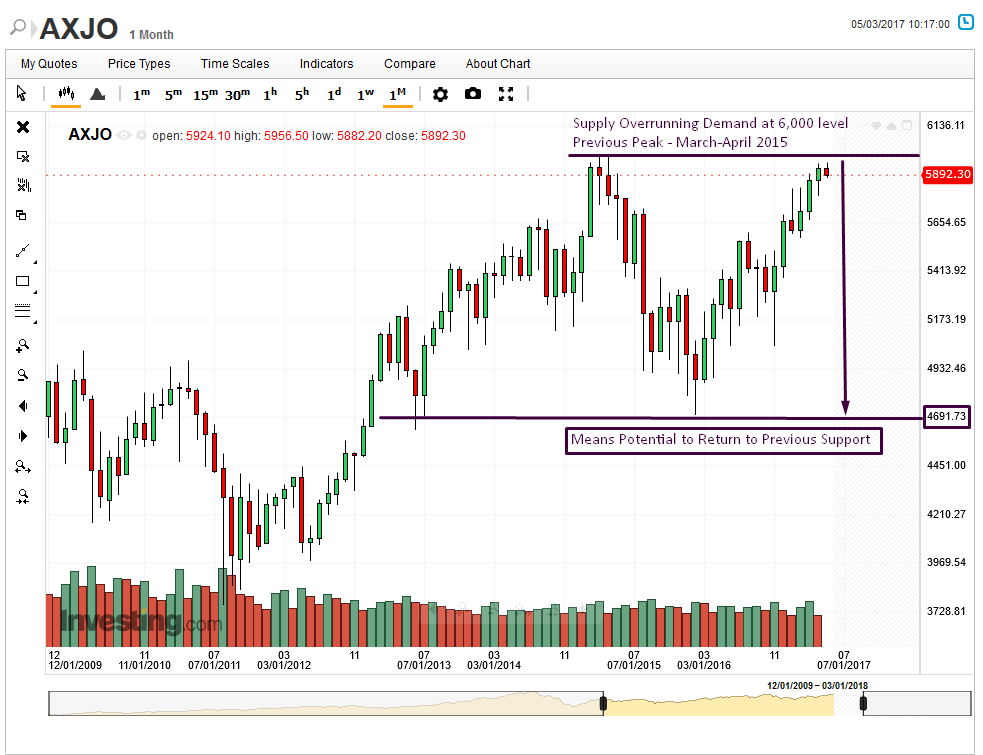
Should this reversal take place, the potential will open for a far greater reversal.

As mentioned above, the location of a pattern is in some ways more important than the pattern itself, as it includes powerful forces of supply and demand. In the monthly chart, above, it's clear that we're now stuck under the 6,000 level, the peak during March and April 2015. Should price fail to overcome this resistance, it may retest its previous, February 2016 low at the 4,700 level.
