Gold, more than most other substances, has been integral to myth, legend and fairy tale. Gold's desirability stems from that most human of characteristics – vanity. The metal itself isn't functional, nor does it pay a yield. Its value is gleaned from its luster and rarity.
Gold's Market Dynamics
After Yellen signaled that the Fed is moving toward a slower path to higher interest rates, gold's value went up. It's biggest drawback, its lack of yield, just became less of an issue. But, gold serves two masters—interest rates and fear. The lower the interest rates on the dollar, the more attractive the yield-less yellow metal becomes; as investors become more fearful of the markets, the more attractive gold becomes.
For a long time these two masters 'walked' side-by-side, but yesterday they began moving in opposite directions.
While the path to higher interest rates has slowed, making gold proportionately more attractive, the Dow – along with many global equity markets – registered new record highs on the outlook of more available liquidity, propping the high valuations of stocks. Normally, when equities rise, safe havens (including gold) fall. However, along with the global equity market records, all safe havens rose: gold, bonds and the yen.
Trend Resumption At Hand?
This abnormal inter-market behavior, which started with the US election back in November, has become the new normal. Now, all three safe havens are on the fence, sitting between reversals and consolidations, prepping for a trend resumption. But we're going to focus solely on gold here.
Two Fundamental Stories Drive Gold
The two big fundamental stories are India’s gold tax hike and South Africa’s new rules which hurt mining.
India is the world’s second-biggest gold importer after China. They are the biggest countries in the world, but China’s economy, the second largest in the world at near-15 percent of the global economic pie, is more than five-times the size of India’s economy at less than 3 percent of that pie.
India’s consumption is crucial for gold. However, India’s government is undergoing its most radical reform in decades. Speculation that it would reach 5 percent, spurred added gold interest and prompted a jump in gold imports, to 126 tons in May.
India's gold tax was set in place at 3 percent on July 1. Last month, inbound shipments jumped to 72 metric tons, from 31.8 YoY, according to unconfirmed reports. Now the Indian gold market is flooded, at the same time the overall retail market is weakening which could continue into the festival season which starts mid-August.
South Africa is the 7th largest gold producer in the world with 140 metric tons, or 4.5 percent of global production. This is a far cry from its the number 1 position it was in just a decade earlier. Plus their ranking is about to fall further. The South African government just signed into law a requirement that at least 30 percent of stakeholders must be black Africans.
Investors are pulling out. Companies say the new rules raise uncertainty about the future and will kill the industry, which is already starved for capital. Most local mining companies had already sold 26-percent stakes to black investors at preferential rates in the early 2000s, having been led to believe that would be a one-time deal. Now, from an investor perspective, the South African government is proving to be completely unreliable.
Although it is impossible to calculate the monetary implication of these two fundamental stories, lower demand by the world’s second-largest importer may at least be partially offset by lower supply from the world’s 7th largest producer.
Gold's Technical Picture

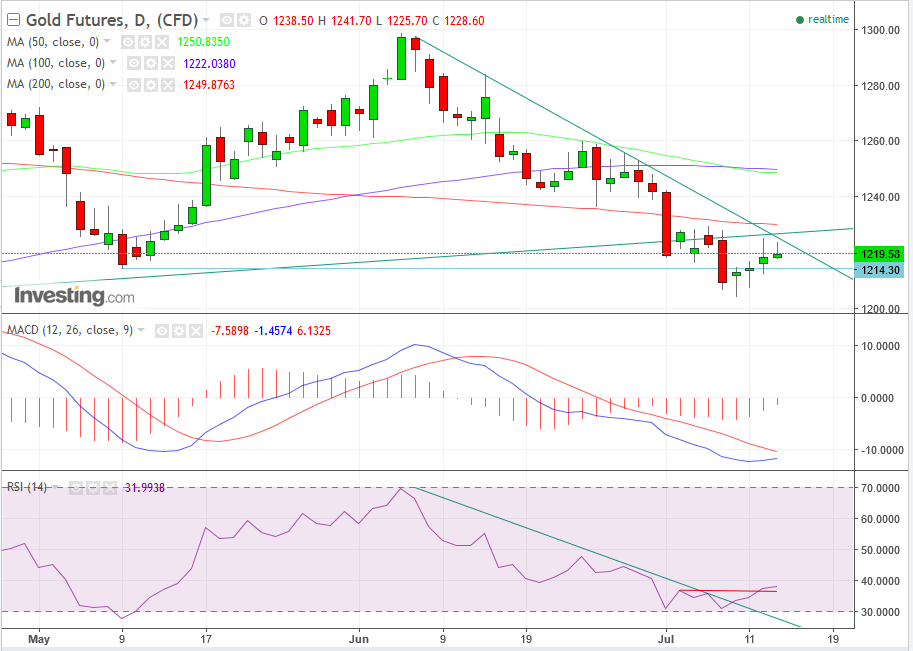
After Yellen’s dovish testimony yesterday, gold futures for August delivery rebounded from a loss, headed for the biggest gain in five weeks on the Comex in New York. Today it extended its gains, coming up to its downtrend line since June 6, which marked the second portion of a double-top, as well as the broken uptrend line since February, above which lies the ominous 200 dma (red). The MACD is turning in a manner suggesting a buy signal; the RSI already provided one when it completed a double top and broke its downtrend line.
As a leading indicator, it suggests the same will happen with the price downtrend line. However, considering yesterday’s price declined upon nearing the convergence of the broken uptrend line since February and downtrend line since June 6 – guarded by the 200 dma, and today it did the same, the picture revealed is bearish. As well, on Tuesday, the 50 dma (green) crossed below the 100 dma (blue), executing a bearish dead cross.
If equities should continue to rise, capital will likely flow out of havens and back into stocks.
Trading Strategies
Conservative traders would wait on a short for a further rise toward the convergence of the June 6 downtrend and broken February uptrend to yesterday’s high of $1,225, which is also psychological round-number resistance.
Moderate traders would wait for a potential return toward $1,222.55, the peak of the last rally, at 6:00 EDT.
Aggressive traders would short now.
Target Prices:
- Retest of the $1.204 July 10 low
- Retest of the $1,196.20 March 10 low
- Retest of the $1,187.90 January 27 low
- The Double-Top – should it hold after the price crossed back over it at $1,214.30, with a cross back below it and a decline past the July 10 $1,204 low, rendering it a return move and nothing more, implies an $83 price movement, the size of the pattern, which targets the $1,130 price level and which puts it on a path to retest the December 15 $1,123.90 low and the start of the rally since.
