by Pinchas Cohen
America The Economically Not-So-Beautiful
America the Beautiful may still be one of the US's most well known anthems, but according to the International Monetary Fund (IMF), America's economy is not nearly as beautiful as it once was. The global economy is less reliant on the US, more on the eurozone, China, Japan and Canada.
This comes after the dollar index has already fallen to its lowest level since June 2016. The slide began after investors bid it up on the reflationary hopes markets had for the newly elected President Donald Trump.
However, that very same Donald Trump told the Wall Street Journal on January 17 the strong dollar was “killing us,” which incidentally, killed the dollar rally.
Since then, ongoing, often disappointing economic reports kept pushing the greenback lower, even as the Fed tried to convince investors that inflation will rear its lovely head at any moment. When Fed Chair Yellen finally admitted what dollar and yield investors already knew—that inflation was not coming as quickly as the Fed had anticipated—it just made matters worse for the US currency.
The final straw, however, may have occurred in late June, when ECB President Draghi began talking merely about tapering, in contrast to Yellen who had already mentioned shrinking the US balance sheet. The euro shot up to its highest price since August 24, 2015 and highest close since January 14 of that year.
While the IMF forecast 3.5 percent global growth this year, it estimates only 2.1 percent growth in the US and not just for this year, but for next year as well.
China, Eurozone, Canada Growing
This lowered estimate is merely readjusting expectations to what they should have been in the first place. The only reason the IMF expected more from the US was because of anticipated fiscal policy from the Trump administration. However, in June the IMF joined dollar and Treasury traders when they finally stopped counting on Trump’s policies for growth.
Furthermore, while the US economy is contracting, other nations' economies are expanding. China’s forecast is for 6.7 percent growth, up 0.1 point from April’s world economic outlook. For 2018, the forecast is a more moderate 6.4 percent, but still an increase of 0.2 points from three months ago.
The forecast for Japan climbed 0.1 point to 1.3 percent. The euro area is expected to grow 1.9 percent, up 0.2 points from three months ago, and an additional 1.7 percent in 2018, up 0.1 point. Even, Spain with all its economic problems, is forecast to be the eurozone’s bright spot for both years, with a revised growth forecast of 3.2 percent. Finally, it looks like Canada will be this year’s economic growth leader, expanding at 2.5 percent, up a whopping 0.6 points from April.
Final Nail In The DXY's Coffin?
The IMF report delivers a double whammy against the dollar. First, it confirms what dollar bears have been saying this year. Second, it may be the last nail in the dollar’s coffin.

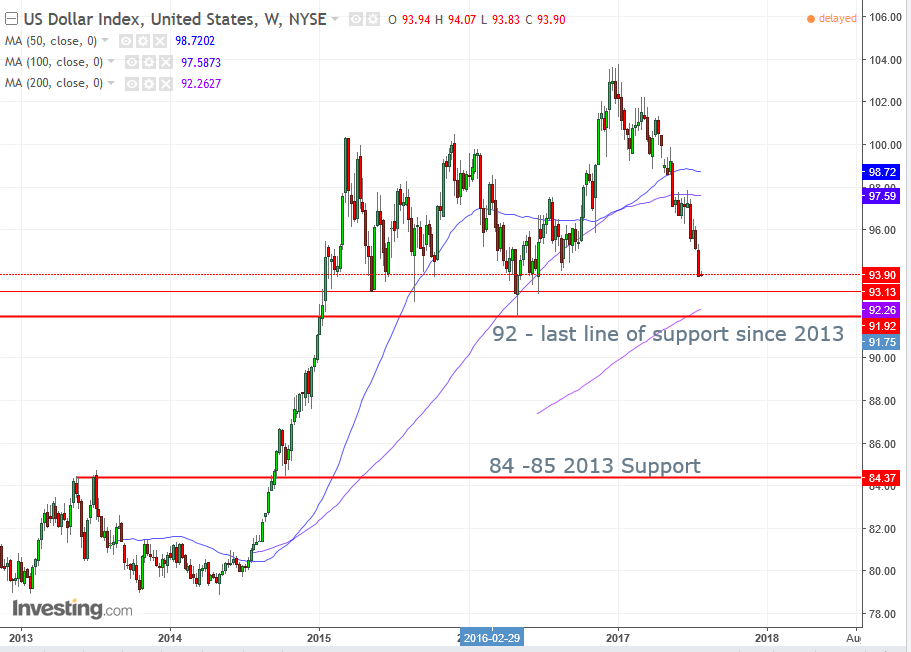
While the index collapsed nearly 10 percent since December, it has moved sideways in a two-year view. The very lowest price during this time is the May 2016 low at 91.92.
Consider that the last level at which you may expect demand. Once that level is violated, there can be no expectation of demand until the 2013 highs at 84.00-85.00.
Naturally, the 90.00 level should also provide psychological round-number support. However, should the $92 price level break, the implication would be of an at least 800 point downward descent – which just so happened to jibe with the 2013 support – and which ultimately takes the index far below the presumed 90.00 support.

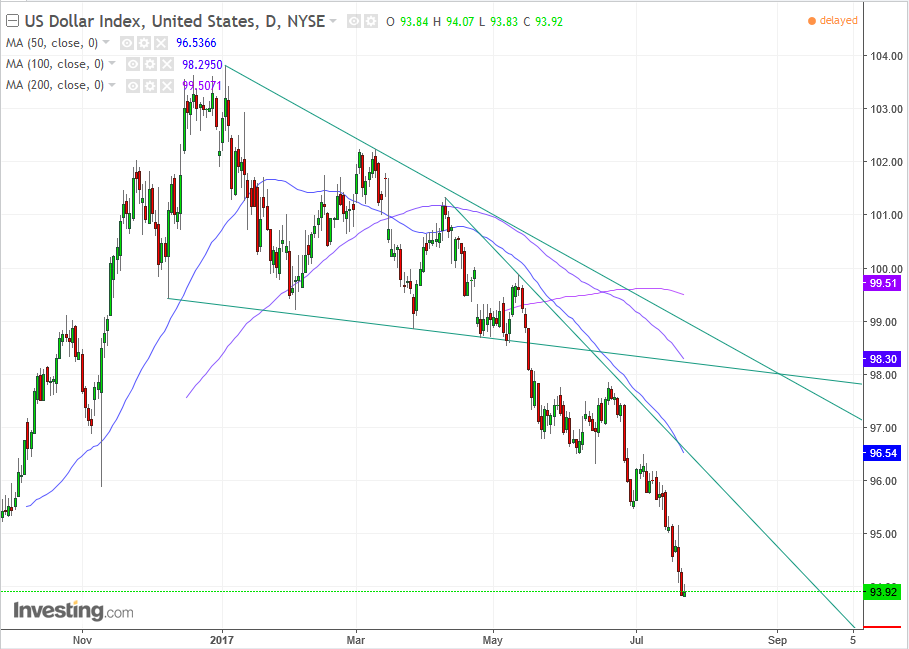
On the daily chart, the moving averages are deep within a bearish pattern, in which recent prices are much lower than longer prices, on the weekly chart – because the currency has moved sideways on a macro level – the price fell only below the 50 and 100 week moving averages, while those are in a bearish pattern.
Note how the 200-week moving average has just crossed above the 92.00 support, in a rush to defend the line. Presumably, it will rise to the 93.00 price level – to reflect a correction in the price – which has proven a repeated support above the absolute low of 92. That level is marked by a thin red line. The price is likely to fluctuate there before it attempts to cross below the last support of the past four years.
Trading Strategies
Conservative traders may be concerned about shorting the dollar, after having seen it already decline 10 percent since its December high. They may wait for a correction. Ideally, the price would return to its December down trendline, but that's very high, and would require a very sharp correction. At this angle, it is situated at 99.00, but since it falls with time, a full correction to the line may meet at 97.00.
Moderate traders may share some of the same concerns and wait for a correction as well. They’d be happy with a correction to the current, steeper downtrend line since April 7. At this angle, it is situated at 96.50, but since it falls with time, a corrective rise will probably meet with it around 95.50.
Aggressive traders would be thrilled to short after a corrective return to the psychological round-number support of 95.00.
Very Aggressive traders may go long on a corrective move, before shorting at the key prices, or upon seeing pressure build up.
