by Pinchas Cohen
The euro is falling for a fourth straight day, the longest slide for the single currency since mid-February. The first daily decline on May 24 was after ECB leader Mario Draghi delivered a dovish speech in Madrid, saying he sees no need to deviate from the policy path.
This settled an argument among his two lieutenants on the correct path to take amid a recovering eurozone. Yesterday, Draghi delivered an even more dovish message when saying that the eurozone still needs “an extraordinary amount of monetary support.” This, just one week before the ECB meeting. Nothing murky about current ECBspeak.
If economics weren't enough for euro traders, risk is mounting as well. The rising probability of a Greek default on failed bailout payment negotiations puts back on the table that on again/off-again risk pair, a Greek bailout or a Grexit. Another rising euro-exit risk is coming from Italy, with former PM Matteo Renzi lobbying for general elections.
Which brings us to the question: is the 1.20% decline in the euro since Draghi’s first speech considered a dip within an uptrend, providing traders with a buying opportunity, or is the euro decline expected to continue?
Euro vs Pound
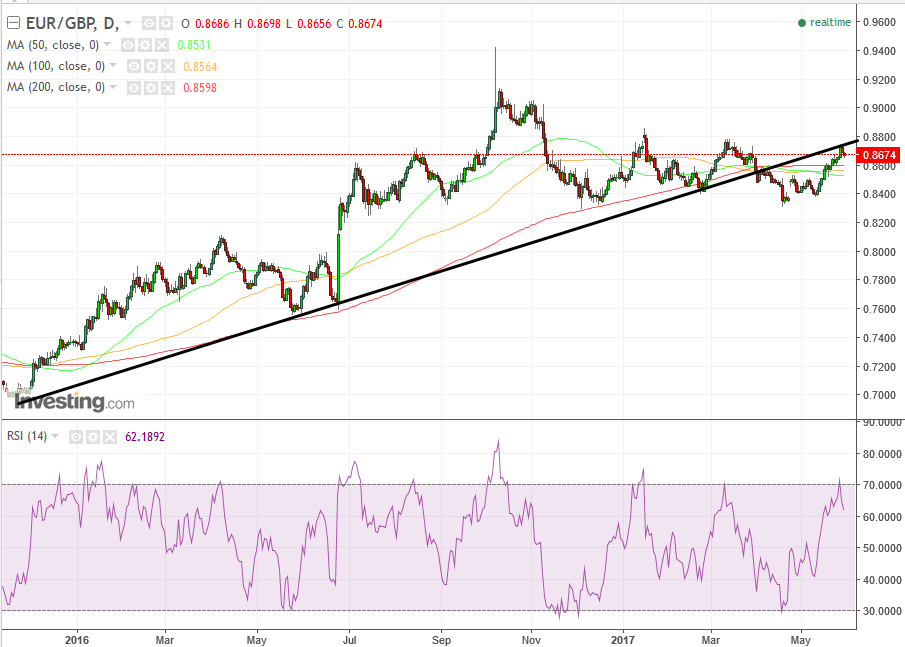
After a 15% rise since the Brexit vote, the euro-pound is our favorite pair to short, as the price completed a return move to the broken uptrend line. This coincided with the top of a falling channel, reached yesterday at a high of 0.8751 and a close of 0.8734.
Today’s decline suggests the resistance of the broken uptrend line, compounded by the falling channel, may hold.

Below, a closer look at the falling price, for a second day, having reached the broken uptrend line since November 2015.
Also, as opposed to the potentially bullish weekly moving averages, the daily moving are within a bearish pattern, with the 200dma above the 100dma, which is above the 50dma. This bearish pattern completed even amid the 5.25% rally from mid-April till this past Friday.
Finally, the RSI reached an overbought level and reversed, providing a sell signal.

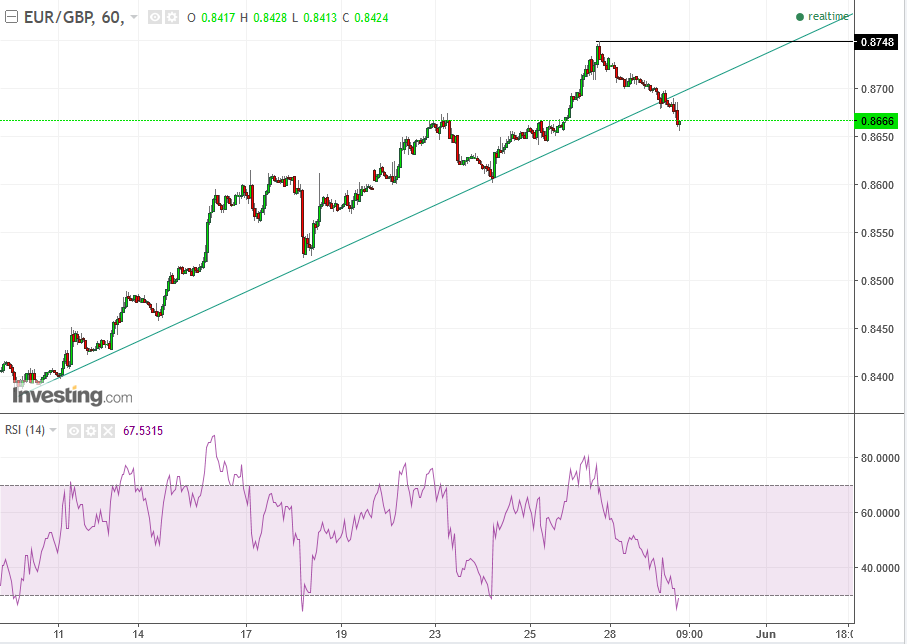
However, traders should be aware that on the hourly chart, the RSI reached an oversold level and the price may rise in a return move to retest the broken uptrend line’s resistance. This can take the price higher than the point of crossing below the uptrend line—anywhere up to the previous peak, at 0.8750
Trading Strategies
Conservative traders would wait on a short for the return move, till the previous peak or until witnessing weakness, once reaching the breaking point of the uptrend at 87.00
Moderate traders would wait on a short for a potential return move to the price of the breaking point of the uptrend, at 87.00.
Aggressive traders, recognizing the confluence of dovish economic policy along with eurozone risk, compounded by a technical reversal and the attractive risk-reward ratio of the price being very near to the double resistance of the broken uptrend line, as well as the falling channel, would probably not wait. They'd short immediately and sit on the position till the price retests the 0.8300 of the previous trough in Mid-April.
