by Pinchas Cohen
The dollar is among the worst performing currencies this year: with a bearish bias, it doesn’t rise on good news but falls on bad news. In contrast, the euro is among the best performing assets this year. While the Fed had to contend with continuously disappointing data, as it tried to boost confidence, the ECB has had the opposite problem. Their data continuously surprises to the upside while the central bank attempts to temper investor enthusiasm.
On June 28 we forecast the euro’s correction, followed up by a rally to 1.1400. Now that the correction and target have been achieved, how might traders proceed?
In our opinion, the euro will make another correction, before it takes the next BIG step.
The euro has been trending up since Donald Trump assassinated the dollar, when he claimed that it was too strong on January 17. In April the euro’s uptrend against the dollar took a sharper turn, as it completed an H&S bottom on an unusually deep rising gap.

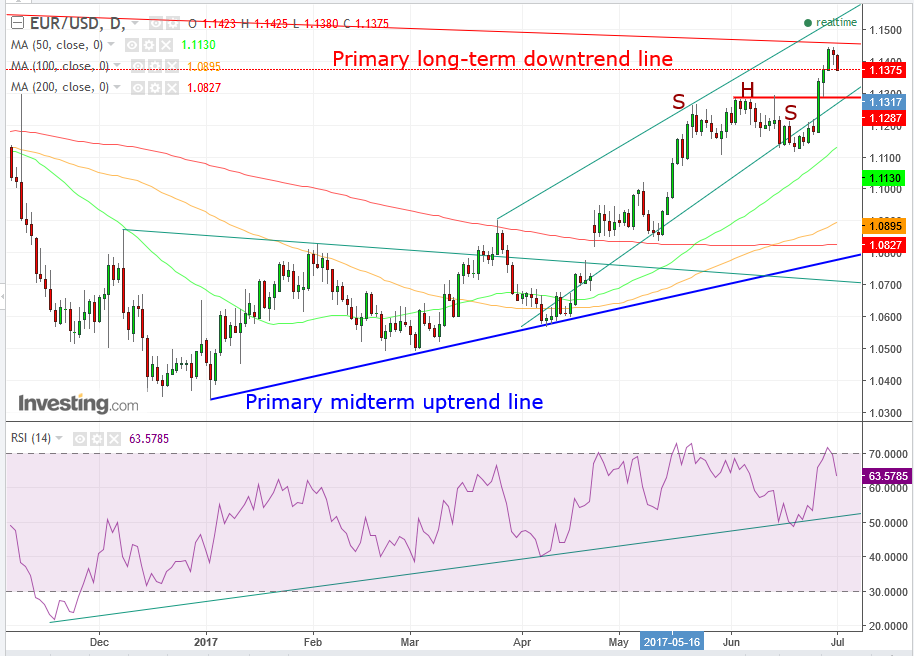
Between May and June, the pair traded within a pattern forming an H&S top, but it failed upon breaking the head’s resistance, turning it into a continuation pattern. On that blowout, we forecast a continued rally to 1.1400, which would then be hit by a powerful resistance of the primary downtrend line since September 2015.
So far that is proving correct as well. Upon nearing the trendline at 1.1453, the price stopped at 1.1456 and formed a “hanging man,” which has the potential of the ominous implication – upon a confirmation of its bearish implication – that its name implies. If there is a lower open in the following session, but preferably a lower close, buyers who bought on the open or close of the hanging man would now be left hanging with a rapidly depreciating asset.
Waiting For A Lower Close

The lower opening is a done deal, and now we’re waiting for the lower close. As of 7:00 EDT, the price is low enough – not only beneath the hanging man’s real body but significantly lower even than its lower shadow and as low as wiping out Thursday’s gains that preceded the hanging man, turning it also into a bearish engulfing pattern. In addition, the RSI reached the oversold territory and crossed below, producing a sell signal – all right below the primary downtrend line since September 2015.
The first test of the correction would be the price level of the failed reversal-turned continuation H&S, at 1.1287. Note how it meets with the bottom of the rising channel, like an X that marks the spot.
However, should the price corrections persist, it would have to contend with the 50 dma (green), as it rises to guard the pattern, at 1.1130 per today’s angle, while the 100 dma (orange) and the 200 dma (red) are guarding the main mid-term uptrend line, at 1.0895 and 1.0837, respectively.
To emphasize, the euro is within a rising trend, and this expected decline is merely within a correction of that trend, much like oil is within a declining trend and its exceptional rally is merely within a correction.
Trading Strategies
Conservative traders might want to see if the potential to correct all the way back to the mid-term trendline is realized, considering that the price is turning back from an almost-2-year downtrend line. At the current angle, it’s at about 1.0850, but as this will probably take a couple of months, it will likely be at least at 1.1000 at the time it reaches it. They are also likely to wait for evidence of consolidation as a sign of a return to the mid-term rallying trend.
Moderate traders will likely wait on a correction to the support of the failed-H&S-pattern-turned-continuation at 1.1287, and seek some evidence of consolidation. They would probably want to see that the RSI’s uptrend line remains intact.
Aggressive traders may ride the expected correction, shorting the euro with a first target at the aforementioned 1.1287 and a possible secondary target of the rising main trendline, in which time they’d turn around to ride it back up with the midterm trend.
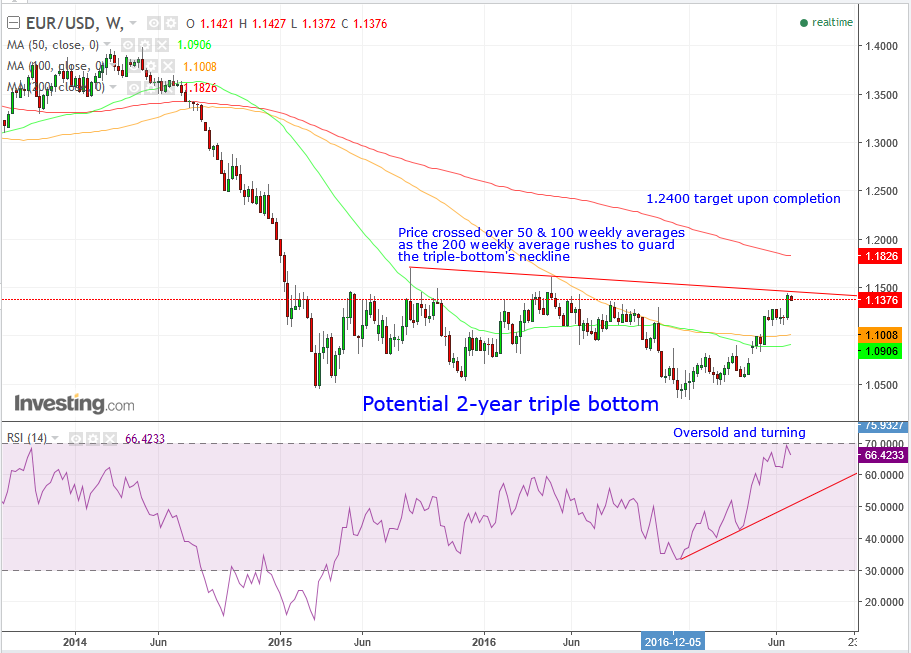
NOTE: We expect the pair to return to 1.1287 and rally in return to retest the nearly 2-year downtrend line and probably cross over it. Should this take place, it will have completed a massive nearly two-and-a-half-year triple bottom, with implications of a rise to 1.2400.
