by Pinchas Cohen
“The trend is your friend” is perhaps the most overused adage in chart analysis. Yet despite how basic a concept it is and how often it's quoted, one suspects that few understand what's really being described and possibly even why or how it works. Just recently, if they were paying attention, Fed Chair Janet Yellen provided traders with a lesson in trend psychology.
Yellen's Lesson in Trading Psychology
For all of last year, the investing community was critical of Yellen for remaining dovish when—in their opinion—a hawkish position was called for. Data releases kept suggesting the US economy had bottomed and was picking up, thus it was time to restart the tightening cycle. But Yellen refused to pull the trigger.
Then, after the disheartening first quarter growth in evidence this year, the investing community convinced themselves Yellen would take note of the recent data soft patch and remain dovish, opting for monetary inaction. Obviously, as of yesterday's rate hike, that wasn't the case.
Did you catch that? Janet Yellen, Chair of the Board of Governors of the Federal Reserve System is trending. Once she set her mind on an economic outlook—whether justified or not—she stuck with it. We've never looked at trend analysis in quite that way before. Maybe, once an asset moves within a trend, it’s more likely to continue in that direction than not, because it takes people time to change their minds.
Whether the Fed is right or not regarding their inflation forecasts is less relevant for traders, but is key for longer-term investors, as the Fed’s main concern is the bigger picture. What matters for traders is what the market thinks, because that’s what determines prices.
What Does The Market Think?

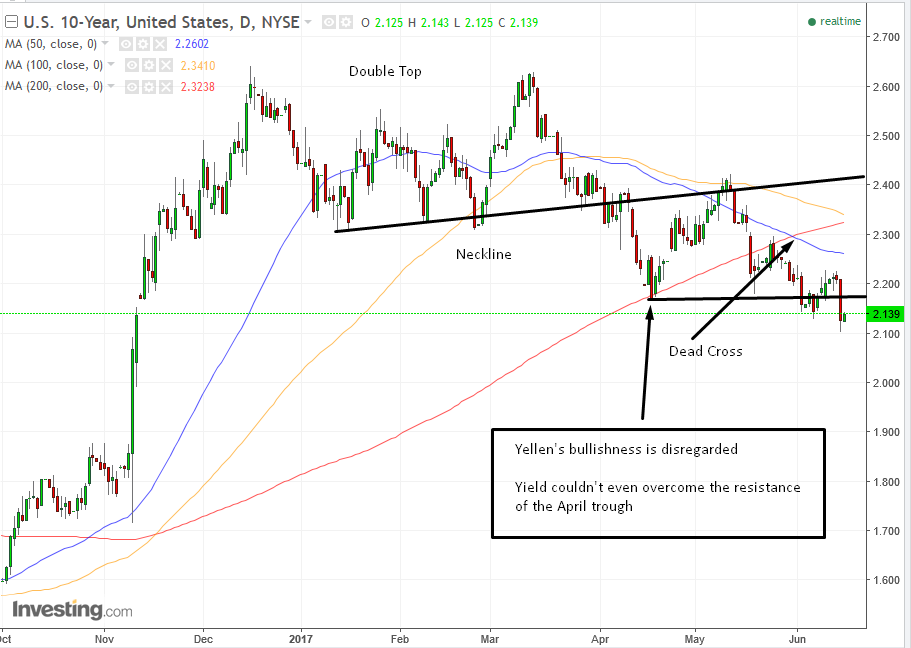
So what does the market think? US 10-year Treasury yields stayed near their seven months lows despite Yellen’s hawkish message.
This confirms the downtrend that started after the completion of a double top in 10-Year Treasury yields, from late 2016 into early 2017, with December and March peaks above 2.6 percent. It completed upon crossing below the neckline at about 2.36, the horizontal support line connecting the peaks' troughs.
At that point there was a bounce, when the yield executed a return move to retest the broken neckline, moving a bit above it to the 2.4 percent level on May 11. It then fell hard,to 2.18 by May 18. Since then it extended its decline, dismissing the multiple rounds of Fedspeak that talked up the country's economic growth and future hikes.
Clearly, bond traders are simply not buying it, or they wouldn’t invest into lower yields now.
Naturally, biggest beneficiaries of rising rates are banks, since that's their bread-and-butter. The financial media cheered the recovery of bank shares, which had declined ahead of the meeting.
Bank Shares Buoyed By The Rate Hike?
The bigger picture trading pattern of bank shares, however, reflects the same pessimistic outlook projected by bond traders. This near-term recovery may in fact provide a good shorting opportunity.

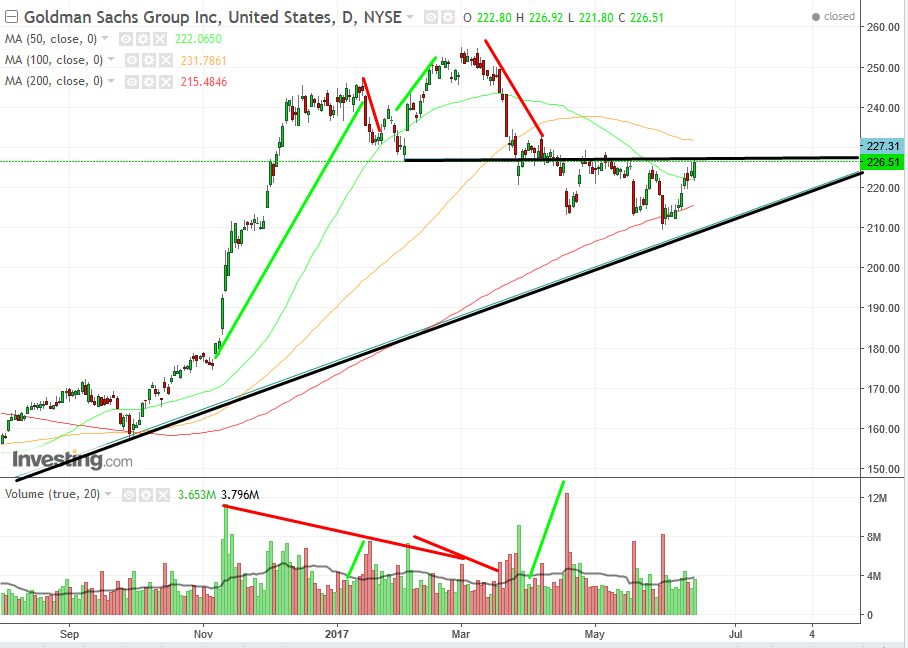
Among the banks that recovered, Goldman Sachs (NYSE:GS) is our favorite (to short). Demand is so weak, that it failed to form the right shoulder of a H&S top.
During December-January it formed the left shoulder at the $245 level; during February and March it formed the head at the $254 level.
By March 24 it had returned to the neckline at $227 where it failed to hold on to that support; by March 27 it slipped to $220.85.
At that point price attempted another upmove, but on April 5 stopped very short of forming a right shoulder at $232.89. It's been sloping downward ever since.
Yesterday’s big 2% advance to $226.51 failed to overcome the resistance of the shooting star that just so happened to be directly below the neckline. Instead, the focus for many was on the fact that price found the support of the 50 dma (green), at $226.51, before it jumped.
That’s akin to getting excited that you've found your watch even as your house is burning down. It ignores the fact that the same 50dma crossed below the 100dma in April, and both moving averages are pointing down.
Let’s now analyze participation...whether transactions increase when the price rises or declines. The first sharp jump from $180 to $210—the first leg of the so-called Trump Rally—was in fact supported by massive volume.
However, the second leg up, from $210 in late November to $215 in December—which formed the left shoulder—was on lower volume. And the third and final leg up in February, from $227 to $255—forming the head—was on even thinner volume.
On the other hand, the sharp decline in February, completing the left shoulder, was supported by rising volume. Same for the sharp fall in March, completing the head.
If you study the volume of the price action, you'll find that volume diminished on rallies and spiked on declines. That tells you where the money is.
Trading Goldman Sachs
Conservative traders would note that the primary uptrend line, which began last June, has not yet broken. If they’d like to stick to the trend (it is, after all, supposed to be their friend), they may want to wait for its break.
Moderate traders would appreciate the excellent risk-reward ratio between the resistance of yesterday’s shooting star, compounded by the neckline at $227.05, to the support of the uptrend line, which per this angle is at around $211. But since it’s rising, it will more likely coincide with the 200 dma (red), which per this angle is at $215.48. A safe place for a stop loss is above the 100 dma (orange), above $232. If you can’t afford that, you may not be a moderate trader.
Aggressive traders whose money management doesn’t allow a stop loss above $232 would still enter a short and if they can afford it, would place the stop loss at least above $230, the previous peak and the psychologically round number.
A first target would be $220, the support since last Friday. A second target would be the next congestion, which is also where the 200 dma (red) lies in wait, at $216. Should the stock's price decline resume, at this point it would probably break the uptrend line, meaning it could potentially plunge till its next support at $180.
