by Pinchas Cohen

On May 23rd, we published Is Bitcoin’s Wild Ride Over For Now?. Our thesis was that Bitcoin investors got ahead of themselves. In the following three days Bitcoin was down 21 percent in value.
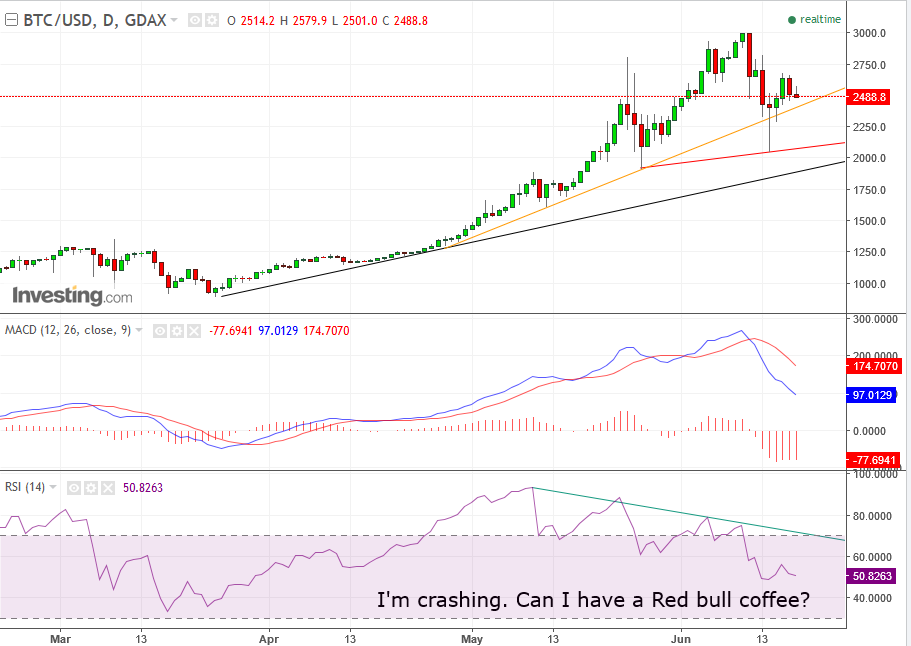
Upon reaching its downtrend line since late April, the crypto-currency rallied 57 percent to $3000 on the nose, intraday June 11. During the following four trading sessions, it declined until, on June 14, it hit an intraday low of $2050.2, a plunge of 31.5 percent. Since that intraday low, it has popped again, jumping 30.45 percent within three sessions until June 16.
Valid Currency, Save Haven or Somewhat Shady?
These violent swings revive the old arguments about the validity of crypto-currency.
Opponents argue, 'How can it claim to be a “store of value” when you can lose 30 percent of that “value” in just four days?' And did anyone say “safe haven?”
Without doubt it's been very exciting to read about traders who made 150 percent this year on their Bitcoin investments. So far however, the currency's business model has been based on demand by online gamblers and money launderers, hardly the stuff of a reliable long-term, safe investment.
Proponents rave about the technology and its structure, which imbues it with an objective value that's free of government meddling. There's something to be said for that, of course, when the world's major markets, and FX, are at the mercy of central bank policies, something many find controversial.
Bitcoin's recent 20-percent rally in 3 days, from last Wednesday through Friday, came on the news that developers have reached an agreement on a technological upgrade that had threatened to divide Bitcoin into two separate assets.
Putting aside the fundamental argument, let's consider the crypto-currency's one 'constant' —price.
Technical Analysis
The price of Bitcoin is in the midst of forming a potential massive H&S top, in which the 21 percent loss over the three days following our previous Bitcoin-focused article formed the potential left shoulder; the 57-percent rally that ensued formed the potential head, and last week’s 30.45-percent bounce off the uptrend line since late April formed a potential right shoulder.
The pattern is completed only if, and when, the price crosses below the neckline, the line connecting the two previous lows: on May 26 at 1913.2 and on June 14 at 2050.2. Should the neckline fail to support the price, it would obviously also mean that the uptrend line, which is higher, failed to support the price. More significant—at this trajectory the price will almost certainly fall beneath the longer uptrend line from late March.
To avoid bull traps, traders employ filters. A good one is the breaking of an uptrend line. Considering the drastic volatility of this asset it would be prudent to wait for a clean break of the primary uptrend line.
The MACD’s shorter moving average provided a sell signal when it fell beneath the longer moving average, suggesting the more recent prices are becoming weaker, and the MACD provided a second sell signal when it fell below its support of the 0 line.
The leading-indicator RSI is screaming a divergence between the momentum and the price, as it trends down, which started on May 10.
Managing Bitcoin Price Targets
Price Targets:
- 2370
- 2100
- 2000
- 1880
- 1300
The price target is measured by the height of the pattern—$950—between the top of the head on June 11 at $3000 and June 14, the bottom of the right shoulder at $2050.2. That’s a 46% decline.
The price targets above are based on supports along the way, so traders can use them to manage their trades, measuring their account’s stamina and their own patience. They may also use them to exit on a support and re-enter when the support failed the prevailing trend, when it is expected to turn into a resistance.
Conservative traders would wait for a return move to retest the neckline’s expected resistance, which occurs about 2 out of 3 times, and is more likely to occur with Bitcoin because it's so volatile.
Moderate traders would at least wait for a filter, if they’re afraid of an opportunity loss in case there is no return move—once the price crossed below the neckline. Filters fall into two categories, price and time. Depending on their risk-aversion, an appropriate price would measure the percentage of the price’s fall once crossing below the neckline. With more normal assets, the classic filters are 1 -3 percent, but those hardly seem meaningful when prices swing tens of percentage points in just a few days. Perhaps, a more relevant filter would be 10-30 percent. Time filters are also used according to risk aversion, anywhere from 1-3 days, while some insist on a weekly close below the neckline.
Aggressive traders may rely upon the $2700 resistance level of the shoulders. Less aggressive traders will wait for at least the breaking of the neckline, if not for filters. Naturally, they can use a thin filter, as described in the previous paragraph.
