by Pinchas Cohen
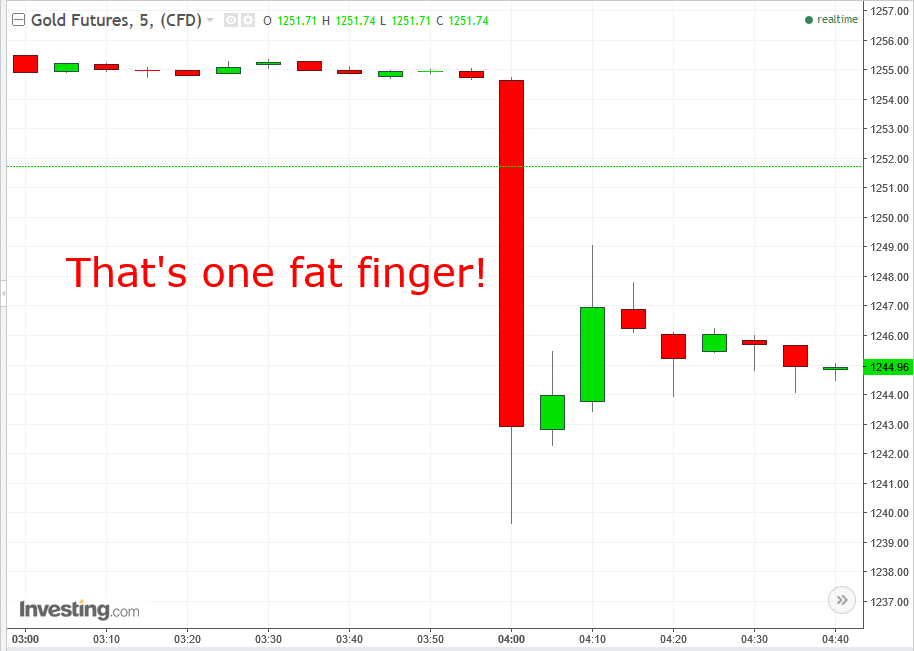
Gold traders were at the receiving end of a rude awakening when the price of gold plunged sharply from $1,254.76 at 3:55 EDT Monday to $1,239.62, or 1.2-percent inside a minute at 9 AM London, after an extraordinary spike in volume in New York Futures. While the cause is unknown, gold traders point to a 'fat finger' event, aptly named to indicate that a trader may have inadvertently pressed a button and their finger got stuck. During last night's event, trading jumped to 1.8 million ounces of gold in just a minute, likely on an assumed erroneous order.

For perspective, that's more than the reserve of 55 of the 100 countries listed on the World Gold Council, an association whose membership includes the world's leading gold mining companies and is a tenth-and-a-half of one percent of the global reserve.
While some analysts say it was an anomaly within what is still a gold bull market, others believe these moves will become more widespread, and the more they happen the worse they will become as traders back away from holding positions in the commodity.
While gold has been accepted as currency throughout economic history, it is not currently productive. It’s only growth value right now is based on fear. Gold investors hope that the general population will become fearful enough about political or economic risk to turn to the yellow metal for its safe haven status, thereby raising its value.
No Clear Consensus On Gold's Future Price
In the confusing market dynamic of the past 12 months—in which risk- and safe-haven assets have risen in tandem—fundamental opinions on the future price of gold abound.
For the moment, let’s look at the trajectory of the price based on the dynamics of supply and demand.

The price of gold bottomed on December 15 at $1,123.90, marking the end of the Trump reflation trade. The first leg up moved 8.4% to under $1,220 in less than six weeks. The uptrend has tempered since then, advancing in a much more sustainable way.
Yesterday’s flash crash was fundamentally different than previous significant declines. The 2010 US stock market flash crash corrected within 36 minutes and the pound's flash crash during a late October Asian trading session lasted just two minutes.

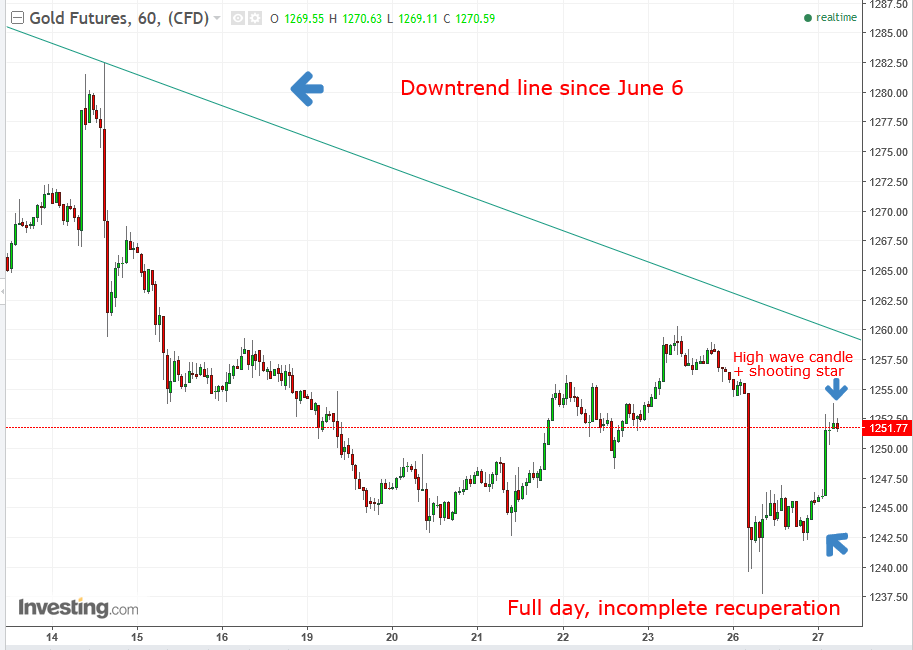
Yesterday’s sudden and sharp plunge in the price of gold however didn’t reverse until a full day later, nor did the price of the precious metal fully recuperate. By 5:00 EDT the price was $1,253.90, while before the plunge the commodity was trading at $1,254.76.
The price declined after reaching under $1,254 and formed a bearish shooting star. As well, during the first half hour it declined below the real body of the shooting star, as well as the preceding high wave candle, also completing two-candle bearish engulfing pattern.
The length of time and incomplete correction suggests it isn’t in fact so much a flash crash as much as simply a good old-fashioned selloff, intentional or not.
Gold's Bigger Picture
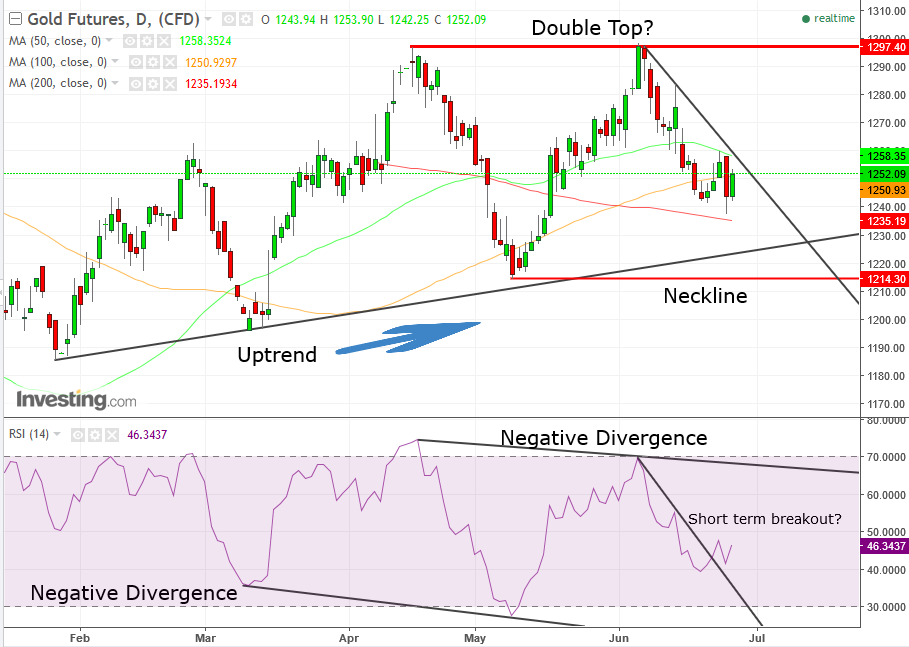
While in the short term the price has been trending down since June 6, it is considered a correction within an uptrend since January.
Yesterday’s plunge, upon nearing the corrective downtrend line since June 6 came closest to the long-term, tempered uptrend line since January 26. Before swing traders rush on a long position, however, be aware that the current uptrend is in question.
While an uptrend requires each trough to supersede its predecessor—as the price of gold has done with the last May 9 trough of $1,216.10 higher than the March 10 trough of $1,196.20—the same is required of rallies. However, the last rally, on June 6 to $1,298.80, failed to meaningfully overcome its predecessor from April 17 at $1,297.40 which was merely $1.40 lower.
The two flat tops are the prelude of a potential double top. The neckline, the low between the two tops, is the May 9 trough of $1,214.30.
Since June 15, gold's price has been trapped between the 50 dma (green) and the 200 dma (red). Even yesterday’s plunge didn’t help it escape its prison.
After gold rallied today, it fell back below the 100 dma (orange). This bullpen provides an opportunity for range trading. Traders could go long when it reaches the bottom at the $1,240 price area and short when it reaches the top at the $1,258 price area, providing an $18 range.
For less active traders, a breakout would provide a more suitable trading opportunity. An upside breakout would retest the resistance of the two peaks; an upside breakout would retest the January uptrend line and finally the neckline at $1214.
Conservative traders who wish to range-trade only in the direction of the prevailing trend face a conflict. On the one hand, the presumed trend is still upward, albeit the failure of the June peak to move higher raises a red flag, but the leading momentum RSI indicator that measures the speed and change of price movements suggests a trend shift.
It registered a double divergence, as both peaks and troughs descended, whereas the price troughs ascended and peaks remained flat. The only hiccup: unlike the price action still under the June 6 downtrend line, the RSI has crossed above its corresponding downtrend line, suggesting a short-term upside price breakout.
Gold Trading Strategies:
Range Trading
Range traders would short as the price nears the $1,260 level, with a stop loss above it and long when the price nears the $1,240 price level, placing a stop below it.
Breakout Trading
Trading the breakout will provide a more obscure map, as a downside breakout nears the support of the long-term uptrend line and an upside breakout would approach the two-peaks’ resistance (although, the resistance is 3% away, much farther than the presumed 0.5% distance from the uptrend line’s support upon a downside breakout).
Though a double top can only be called upon a decisive downside break of the neckline, the double RSI divergence leads us to believe the double top will in fact complete, though we'd be more whole in our outlook should the RSI fall back below its June 6 downtrend line.
Conservative traders would wait not just for a downside break of the $1,214 neckline, but would avoid a bear trap by waiting for a return move back toward the neckline—and a filter in price and/or time—with a stop loss above the neckline.
Moderate traders would wait for a downside break of the neckline and up to their point of risk aversion would wait for a return move and employ a light filter.
Aggressive traders would short now, with a stop loss above the range, at $1,260. They may combine an expected breakout trade with range trading by partially cashing out upon reaching the bottom of the trade and prior to a potential breakout, to ensure no loss in case of a quite possible bounce.
