by Pinchas Cohen
Traders Choose To Focus On Bullish Aspect Of Fundamentals

When crude oil reached $43.76, on May 5—its lowest level in six months—on continually rising US oil production, OPEC and NOPEC producers announced they were preparing to extend the production cuts they'd put in place early this year for another 6 months, into 2018.
This pushed the price of crude back up to a close of $46.22, forming a very long hammer on the daily chart, generally a bullish signal. Still, this particular hammer had a small upper-shadow, for failing to close at the day's high, which can weaken the bullish sentiment.
The hammer proved effective, however, and as of yesterday's close of $49.07, oil was at a two-week, after US crude inventories declined for a sixth consecutive week, an appetizer ahead of next week’s OPEC meeting in Vienna, when they are expected to extend supply cuts.
It should be noted though, that the Energy Information Administration said US inventories fell 1.8 million barrels for the week of May 12. That figure is 25 percent less than the 2.4 billion barrels forecast. Still, rather than be bothered by the lower number, oil traders focused on the fact that stockpiles fell for a sixth straight week.
But Uncertainties Weigh On Price

However, it isn’t as simple as that, nor necessarily as bullish. After falling out of the rising channel pattern that's been in place since May 4 (which clearly demonstrates that both buyers and sellers agree that oil should continue to climb since both groups are buying and selling at ever-rising prices), the two high wave candles during the 2 week-rally demonstrate investors’ ambivalence regarding the efficacy of OPEC/NOPEC's extended cuts as a deterrent to US shale production increases. Of concern as well is whether compliance with the cuts, which is already eroding, will remain in force for another six months since many of these oil-based economies rely heavily on income from the commodity.
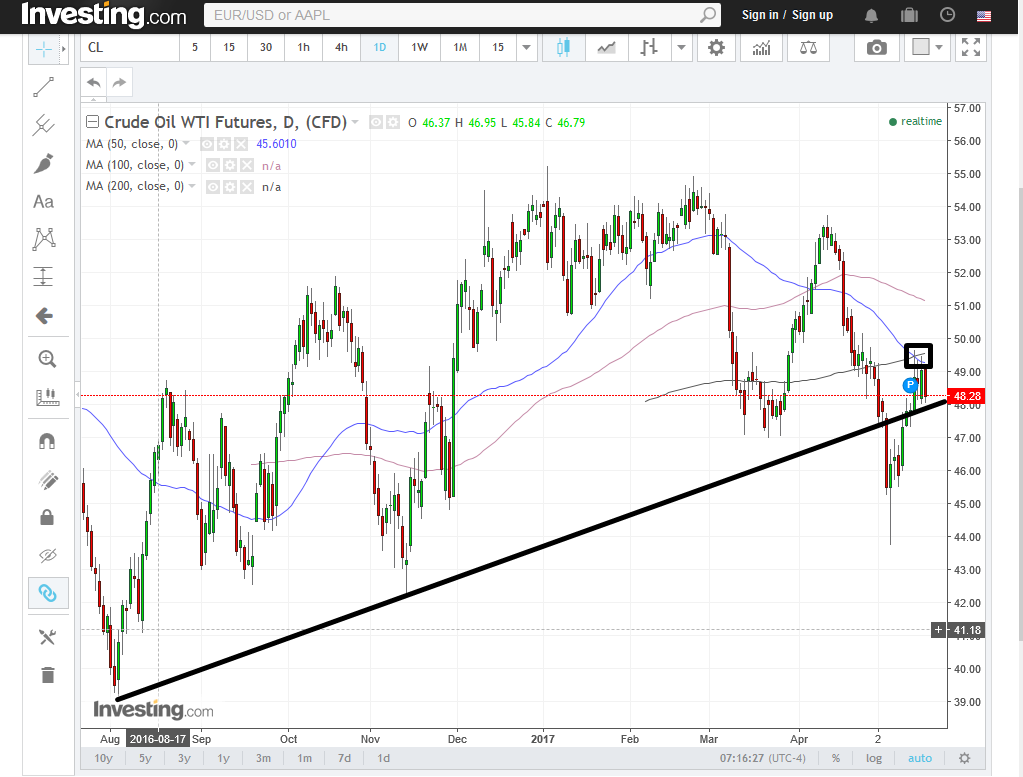
Sure enough, on reaching the 200dma on May 15, oil's price came to a dead stop at $49.66 and closed at $48.85, beneath the 200dma. Three times it tried to rise over this barrier and failed. Today, it didn’t even bother to try, but just declined to the bottom of the last four sessions’ range, nearing $48. Note that although the 50dma crossed below the 200dma, it isn’t considered a dead cross, a most bearish indicator, as momentum of accelerated decline, as the 200dma must be declining when the 50dma crossed below, but as of yet the 200dma is still rising.
Oil Performance Priced in Dollars
Till now we've discussed the commodity itself, but it's also important to remember that oil is priced in US dollars, which has been wreaking havoc on FX markets. Has it influenced oil too as its story unfolds? Indeed. The dollar’s rise also helped boost struggling oil.
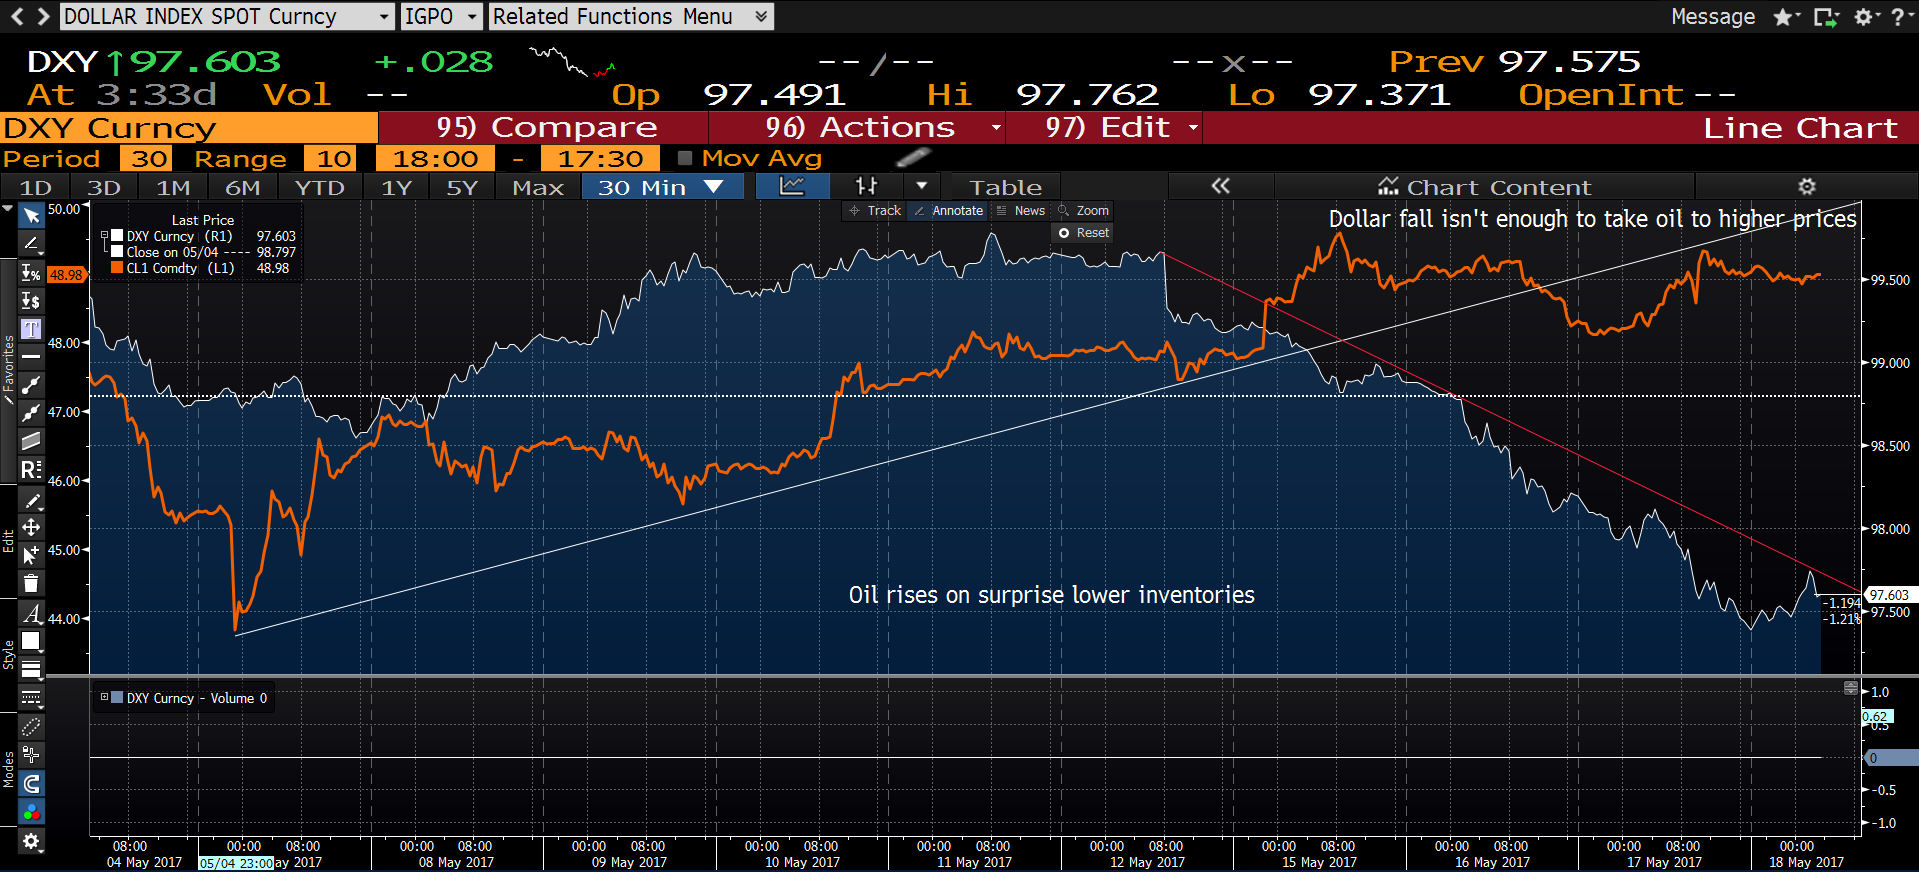
Note on the chart below how since May 4th, oil and the dollar have been rising together. A stronger dollar makes the commodity more expensive, but crude still advanced despite the rising dollar, thanks to the first bullish inventory results in a month and the possibility of extending the production cut deal. However, since May 12 the dollar has been falling, though oil got stuck on the 15th, unable to make new highs despite a falling dollar. As we said above, that expresses investors’ concern regarding US production.

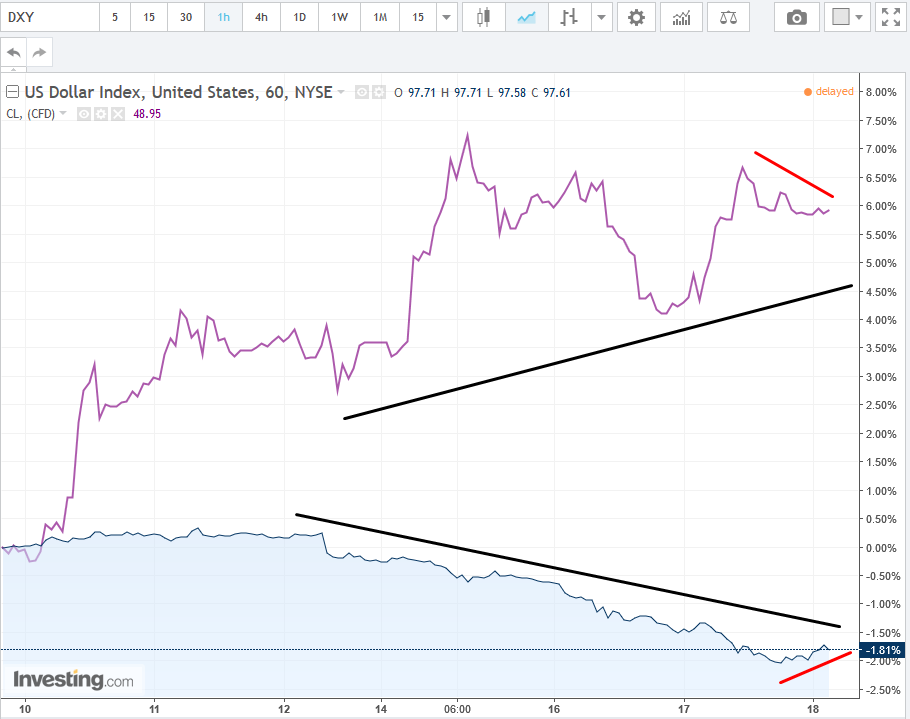
Still, taking a closer look via the chart below, we can see the effect of the dollar on the attractiveness of oil. The dollar’s fall (blue area) correlated with oil’s rise (purple line), and today’s move up in the dollar correlates with a slump in oil. So, within oil's longer fundamentally driven moves, the dollar's effect is tangible in the short term.

Now What?
Oil is down today 1.66%, at $48.25 as of 6:00 EDT. It is has reached the lower bound of the rising channel in play since April 4 and bounced back, recognizing its support. The current range is expected to be between the confluence of the 200dma-50dma at $49.27, as of their current angle. Remember though that since they are “moving” averages, they tend to shift along with the price, so could go to $48.00, the support of the lower bound of the channel, compounded by the round psychological number.
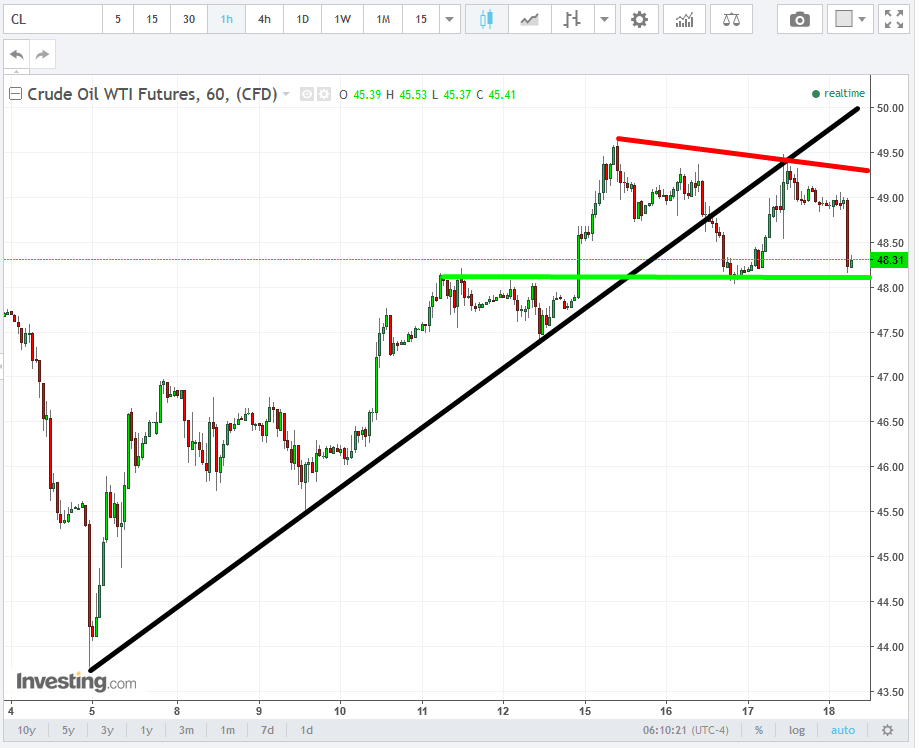
On the hourly chart, above, however, the price of oil on May 16 crossed under its rising trendline, in place since May 5, to complete a return move the next day, which confirmed the now-resistance of the broken uptrend line, and as of this writing, at 6:00 EDT, fell hard, 1.67% to $48.19, for reasons yet unknown, testing the resistance-turned-supported at this level.
A return to $49 may provide an ideal entry for a short back toward $48. A close below $48 may provide a short toward $47. The brave and/or aggressive trader may try to catch this bounce, with a long toward $49.
