As the Japanese yen continues to strengthen for the third consecutive day, it isn’t clear whether the move is due to the currency's safe-haven status or because of conflicting interpretations of comments, by other G7 countries, about its recent weakness.
The outlook of increasingly aggressive monetary policy by the Bank of Japan to overcome persisting deflation has propelled the yen into a downtrend from the beginning of the year, while buoying equities to nearly 3-year highs. However, comments by top G7 officials appear to run counter to Japan’s path of easing, with governors and ministers from the group reiterating they won't use fiscal and monetary policies to devalue their currencies.
Bank of England Governor Mark Carney said today it's imperative none of the members abuse monetary policy to affect exchange rates — a tactic the U.S. accuses China of using, and a key issue in the ongoing trade talks between the two countries.
These contradictory messages mean it's hard to get a clear forward view. And technical analysis also echoes these hazy fundamentals, though the patterns are suggesting an ascending yen despite the BoJ's rhetoric.

Chart powered by TradingView
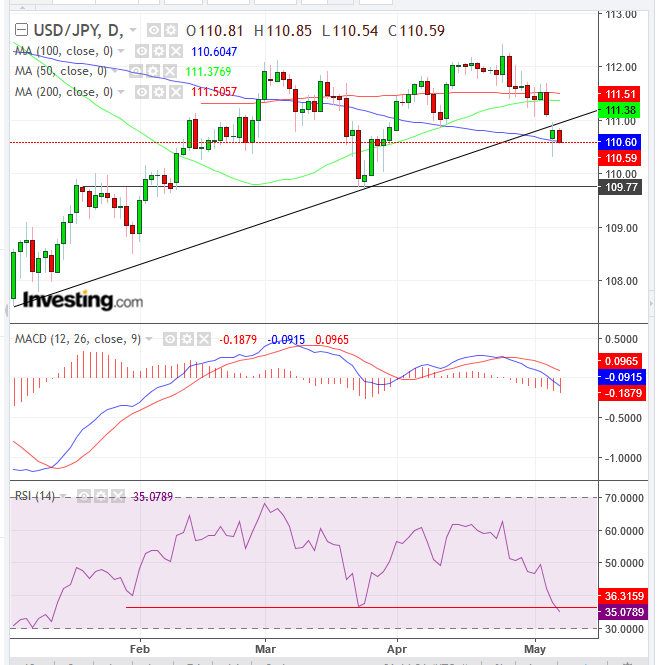
The dollar-yen pair dropped below the short-term uptrend line for the year, after falling below both the 200 and 50 DMAs. While paring some of the fall yesterday, after finding support by the 100 DMA, the price extended the decline and is currently struggling with the 100 DMA.
A further decline below the March 25 low of 109.72 would complete a double top, which the RSI suggests will occur, as the momentum-based indicator is currently below the previous low.
As well, the MACD provided a sell signal, and the 50 DMA curved downward after nearing the bottom side of the 200 DMA, demonstrating resistance.
Trading Strategies
Conservative traders would wait for a trend reversal, with two peaks and two troughs in descending formation. As of now, the Apr. 24 high superseded the March 5 high. As such, the conservative reversal is nowhere in sight.
Moderate traders would rely on the bearish implication of a complete double top, with at least a 2% close below the 109.72 level, followed by a return-move to retest the pattern’s integrity, which can be measured with the minimum of one long, red candle engulfing a green or small candle of either color.
Aggressive traders may short on different benchmarks relative to their risk aversion. For example, they might wait for a close below the 100 DMA and to see whether the RSI closed with a completed double top.
Trade Sample
- Entry: 110.80, upon a bounce off the 100 DMA toward the day’s highs
- Stop-Loss: 111.00, round psychological number and underside of broken uptrend line, now a presumed resistance
- Risk: 20 pips
- Target: 110.00, round psychological number and above the March low’s support/neckline
- Reward: 80 pips
- Risk-Reward Ratio: 1:4
