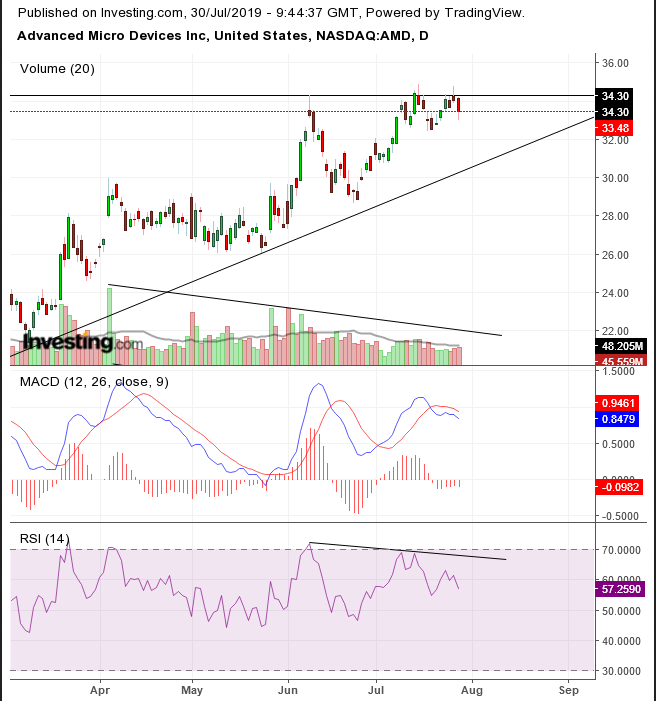
Advanced Micro Devices's (NASDAQ:AMD) impressive advance reached the highest level since 2006 two weeks ago, but is this the time to buy? The technical charts help make the case that this new high should be interpreted as a bearish signal, as demand may be drying out.
The chipmaker is scheduled to release Q2 results today after the closing bell. It has staged an amazing turnaround since its 2016 bottom, as CEO Lisa Su led the company to beat competitor Intel (NASDAQ:INTC).
Still, sales have been slowing down in the last three years, with AMD’s first YoY earnings decline in almost two years. Semiconductors are facing a cyclical downturn exacerbated by the U.S.-China trade war. A study of the supply-demand balance makes the case that the quality of demand is weakening.

On the face of it, a new high is a bullish sign, as there is enough demand to be willing to raise bids to shake down sellers. A deeper study, however, suggests this rising demand may be rotting from within.
Price Resistance
First, the new high on July 16 failed to keep gains, closing lower. Second, it confirmed a resistance by the previous high posted June 10, when it developed a shooting star, followed by a 13% drop in just two weeks. Third, it confirmed the same line of resistance once more when forming yet another shooting star Friday. Fourth, a longer view reveals that this resistance goes back to the September 2018 high. Finally, the price is nearing major tops registered in 2006 and at its all-time high during the 2000 dotcom bubble. Investors have a lot of psychological resistance to overcome at these levels.
Price Trend Already Weakening
The MACD formula compares two moving averages of different periods to ascertain the strength of a current price relative to a longer period. Therefore, it is noteworthy that the MACD’s short MA slipped below the long MA twice, after each of the new highs during June and July, while not even bothering to return higher among the third high last Friday.
Weakening Momentum
The RSI has been providing consecutive negative divergences, as well, as the momentum weekend with each price rise.
Buyers Fall Out
Volume has been diminishing since April in a negative divergence to the price even as this was hitting the highest levels since 2006. In fact, volume has been dropping since August 2018, when the price more than halved in a mere 10 weeks. This indicates that volume has not been supporting the miraculous recovery, and suggests that while some buyers are still upping bids, most buyers have been steadily falling out of the race.
Summary
The trend is still up, in the short, medium and long term. However, the multiple resistances to the price, along with the weakening momentum and diminishing volume dramatically increase the potential for a peak.
Trading Strategies
Conservative traders may wait to go long until after a new high that appears to be sustained, followed by return move that demonstrates support.
Moderate traders may risk a long position upon a pullback toward the uptrend line above $30.
Aggressive traders might enter a contrarian short, providing they have a laid-out plan and understand the risks, not just the potential reward.
