Investors buy shares, seeking growth. The last thing shareholders want to hear is that the company they've invested in has been involved in something illegal. That definitely doesn't fuel investment growth.
Still, that’s exactly what investors heard when the Fed announced on Friday that due to “widespread consumer abuses,”—which were disclosed in 2016 and for which the bank has already paid an $185 Million settlement—Wells Fargo (NYSE:WFC) will be restricted from growing beyond its total assets as of the end of 2017, until the bank has made “sufficient improvements.”
Investors rapidly cut off ties to the bank when markets opened yesterday, as if it had the plague. Traders joined in the fun since the selling promised to become a big move. At least five Wall Street firms turned the knife by downgrading WFC shares.
The price of the stock plunged 9.2 percent. Nevertheless, taking a contrarian stance Bank of America reiterated its recommendation, advising to buy the weakness. Our technical analysis agrees.

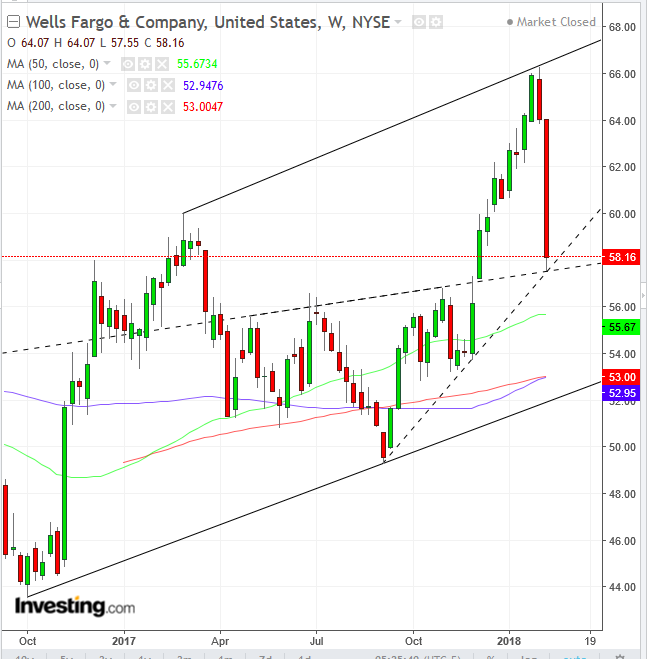
Traders have been trading the stock within a rising channel since October 2016. The fall is halfway of the range, which is natural for supply-demand dynamics. Moreover, the plunge stopped, both above the uptrend line since September 2017 and above a support-resistance line since December 2016. It is this line that made the neckline for a H&S bottom, spurring the December-January 18 percent rise.
That line is the meeting of the hopes and dreams of traders right and wrong, encouraged to repeat a right or discouraged to repeat a wrong. This line is where traders have learned their lesson and joined the other team (rightly, or wrongly, as conditions may have changed), which also provides support. Note how the three major (weekly) moving averages – 50, 100 and 200 – are between the price current level and the uptrend line, or the channel bottom. They too are expected to provide support.

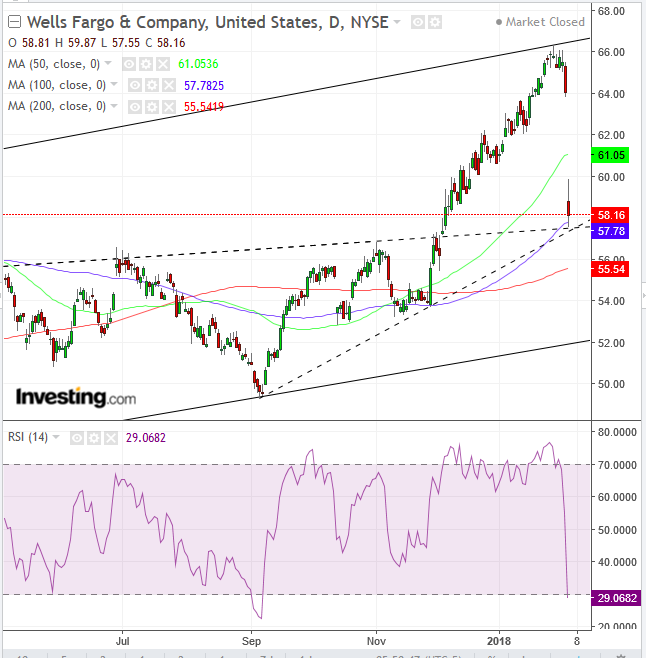
In the daily chart, we can more easily see the channel and the uptrend line since September 2017 and the support-resistance line since December 2016. While the price fell below the 50 dma (green), it found support by the 100 dma (blue), which aligned with both the uptrend line since September of last year and the support-resistance line since December 2016. It is also interesting to note that both trendlines meet at this point.
At 29, the RSI suggests that the asset is oversold, having reached its lowest since September when the uptrend line started.
Trading Strategies – Long Position
Conservative traders would wait for a save entry if the price reached the channel bottom, at $52, at the current angle. Then, they would wait for evidence of demand, as a long green candle would cover the preceding red candle.
Moderate traders may enter a long position at this level after a green candle covers yesterday’s real body (open-to-close price, disregarding shadows, or intraday moves).
Aggressive traders may enter a long now.
Equity Management
A trade should be entered only after establishing the equity management plan. Risk-reward ratio should be at a minimum of 1:3. Therefore, entry, target and stop-loss must be selected accordingly.
Stop-Losses: (1) Below $57.55, low of yesterday, or (2) $55.54, 200 dma (red)
Targets: $66
Example: An entry now at $58.16, with even the conservative stop-loss at $57.00, provides a $1.16, or 2 percent risk, with a $7.84 or almost 1:7 risk-reward ratio, better than double the classic 1:3. Obviously, waiting for a potential return to the uptrend line since September 2017 would provide that much better a risk-reward ratio and therefore statistical winning probabilities. Alternatively, the price might not return to the uptrend line and “get away,” as the trader loses the opportunity. Every safety measure, as well as every risk, has a cost. That is how the balance is kept.
