By Pinchas Cohen
Wal-Mart Stores Inc (NYSE:WMT) is scheduled to release earnings tomorrow before the market opens. Experience has shown that the price of its shares is subject to sharp moves upon earnings releases, which provide exceptional trading opportunities.
Wal-Mart Eyes The Long Run
Analysts expect Wal-Mart to report a $1.07 EPS on a $122.72 billion revenue, while “the whispers” on the street among traders predict a higher EPS of $1.08.
In a bid to keep its stature, it is taking on Amazon.com Inc (NASDAQ:AMZN)'s customers by increasing its online presence, as well as maximizing its own, physical customers, by investing into its employee satisfaction. While this is traditionally good business, it’s hurting earnings in the present. While Buffet-type long term investors may bet their money on that, shorter term traders would likely focus on the bottom line.
In the post-2008 economic environment, in which developed countries rely on consumer spending to fuel growth in a money flow delicious cycle where everyone benefits, yesterday’s release of consumer spending data showed across-the-board retail sales growth in July, with the sharpest advance this year. Should some of this splurging been directed toward the largest retailer in the world, it will be reflected in earnings – if not this quarter's than next's.

Trend Analysis – Bullish
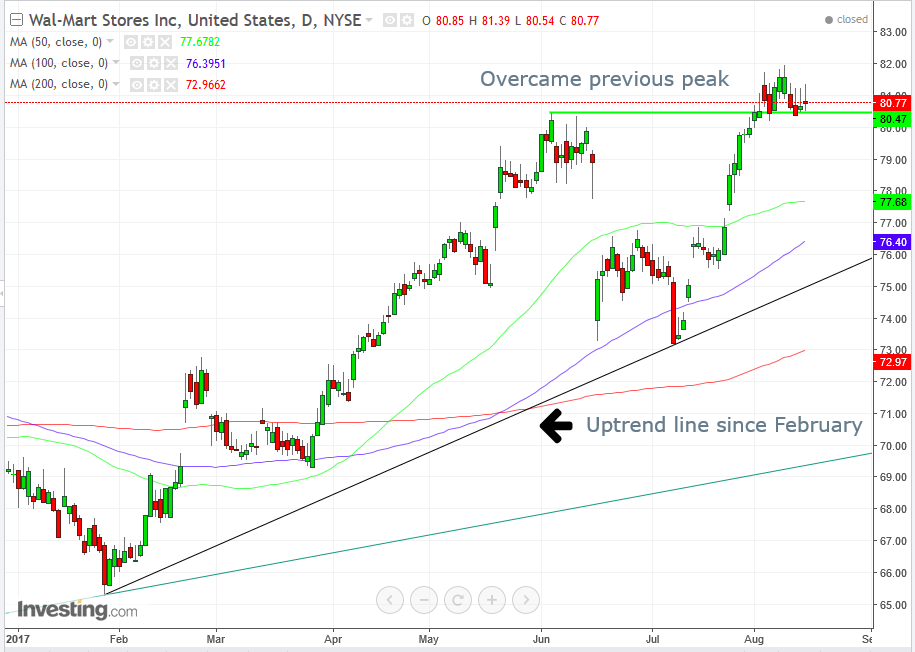
The price overcame June’s $80.47 peak on August 3, indicating an uptrend resumption.
Support and Resistance – Bullish, Mostly
While the price has been under pressure since reaching its August 9th, $81.99 high, it managed to keep its advance past the June peak, suggesting buyers who were right going long and were rewarded for it as well as sellers who were wrong, and were punished for it – are both now buying at the $80 levels.
The damper on the bullish implication of the rally’s resumption, after overcoming the June peak, is the daily pressure on the price – visually projected with Japanese candlesticks. The long upper shadows demonstrate that while bulls pushed the price up, the bears smacked them right back down – three days in a row. The last day produced a bearish High Wave Candle, denoting leaderless panic.

Volume – Bearish
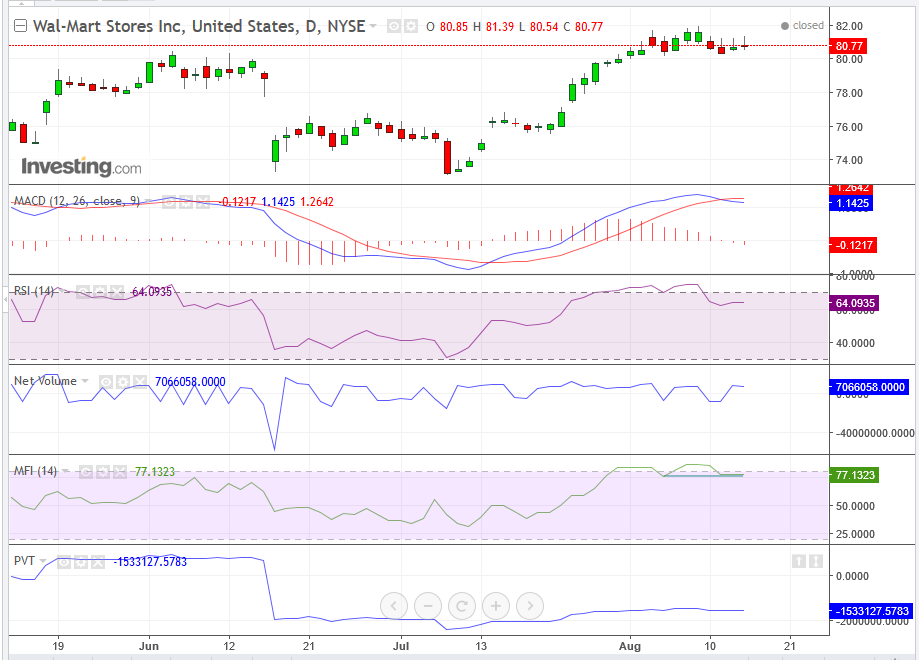
Volume is the second most important asset condition, after price. A rising price can’t rise on forever if there is no participation. Both the Net Volume and Price Volume Trend indicators provide negative divergences. While the August price climbed above the June price, the Net Volume resumed its decline, and the PVT did not overcome its June reading, or come even near it.
Price Data Context – Bearish
To put the current price into context, we use the MACD, which provided a sell signal, when the shorter moving average crossed below the longer moving average on Monday.
Momentum – Bearish
The RSI provided a sell signal, after reaching an overbought condition during the August price peak, which proceeded to complete a double top.
Capital Flow – Bearish
Investor capital too reached an overbought condition on the Money Flow Index, and is on the cusp of falling below its August 4th low, signaling a downturn.
Go Short Now, Long Later
While the trend analysis demonstrates the uptrend is intact and support-resistance analysis demonstrates buyers have been overcoming the sellers above the $80 levels, the price has been under pressure ever since it made the new peak.
Furthermore, while it did manage to overcome the former peak, it failed to take up the next leg. A trend requires both higher peaks and troughs, and the last rally failed to produce a higher low – which requires a climb higher, the point of origin being the low.
The August 9 peak advanced nearly 10-percent above the trendline. In the two previous peaks, of June 5 and February 24, after that advance it returned to the trendline.
Indicators of all the different facets of price action – including daily resistance with Japanese candlesticks, volume, comparing price averages, momentum and capital flow – suggest the price is higher than its demand supports. This suggests at least a correction, a return to its uptrend line, with its current angle at $76. The 100 dma (blue) is catching up with the 50 dma (green), and a decline might be stopped in between the two at about the $77 level, where the uptrend line might be, to support the price.
July’s best retail sales data of the year should be reflected in the next corporate results; even more so, if positive retail sales are set to become a pattern.
Therefore, both fundamentally and technically, odds favor a short now, followed by a long after a dip.
Trading Strategies
Conservative traders would avoid selling against a rising trend.
Moderate traders may sell, upon a rising correction, toward the $82, August 9th peak, where sellers are expected to resume selling. Note, however, that an upside surprise would gap over and stop-loss, placing no cap on your losses. In such a case however, it might be prudent to hold on to the position until the next earnings release, which will include July’s highest retail data of the year.
Aggressive traders may short now.
Price Targets
- $80 which is psychological support.
- $77 which is May-July support-resistance where traders joined forces to either buy or sell.
