Intel (NASDAQ:INTC) is expected to smash expectations when it reports its results this Thursday after the closing bell.
The chipmaking giant is expected to report $1.11 EPS with a revenue forecast of $18.53 billion, versus $1.06 EPS and $15.68 billion in revenue for the same quarter last year.
Crushing expectations is obviously a good thing—until it dawns on traders that perhaps the bar had been set low. So after the Q2 report, anything could happen.
Investors might kick the can down the road, as in: push prices higher hoping they won’t be caught up the creek without a paddle; or they could determine that valuations of about $60, in line with levels prior to the January corporate results before COVID-19 hit markets, is not justified. It may come down to company guidance, after Intel scrubbed its full-year forecast in April.
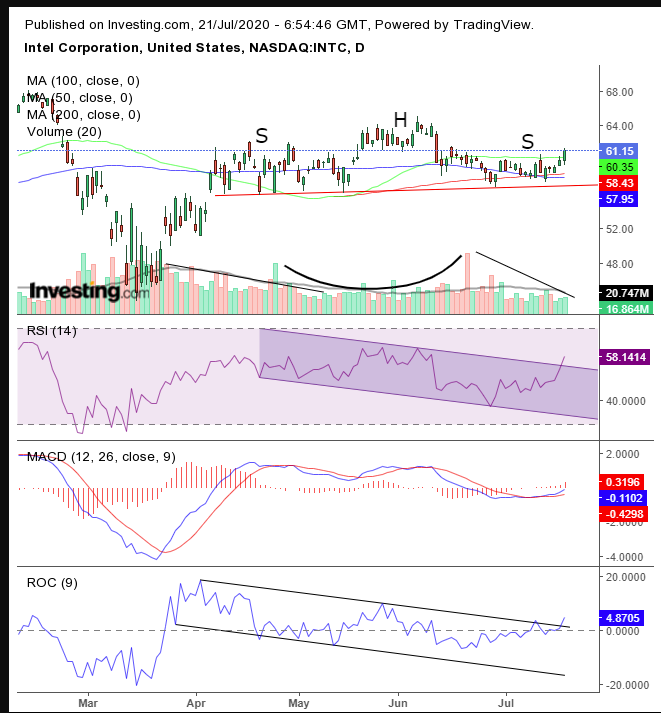
We may not be able to fully predict the fundamentals, but one can recognize this ambivalence in the technical chart.

The stock has been trading flat since early April, developing a H&S top, complete with a decisive downside breakout.
The MACD, the RSI and the ROC have been falling, though yesterday’s advance in the price has seen the latter two peeking above their downtrend lines. The MACD is producing a bullish cross, but from a midway range, which is not as impressive a signal as if it turned from an oversold condition.
So, we see that, like the price, indicators are inconclusive, as a single day’s breakout is not necessarily sustainable and the MACD is weak. Also, volume is still moving in the opposite direction to the price, suggesting ambivalence among traders. The current advance in the price is happening on low volume, a pattern that supports the H&S scenario.
This drift demonstrates a lack of decisiveness by traders. A downside breakout of the neckline at $57 would complete a reversal, while a move above the June 5 high of $65.11 price would cause a pattern failure, or blowout, which would force momentum in the opposite direction of the trajectory of the pattern, as traders shift positions accordingly.
Trading Strategies
Conservative traders will wait for a pattern resolution, with a downside breakout, or failure including a 3% + 3-day (preferably including a weekend) filter to avoid a trap, and a return move to verify the move.
Moderate traders would also wait for the structure to resolve itself, banking on a 2% & 2-day breakout, and then a corrective move, for a better entry, not necessarily for proof of trend.
Aggressive traders would short or go long, after a 1% penetration in either direction.
Trade Sample—Aggressive Short Position
- Entry: $56
- Stop-Loss: $58
- Risk: $2
- Target: $48
- Reward: $8
- Risk-Reward Ratio: 1:4
