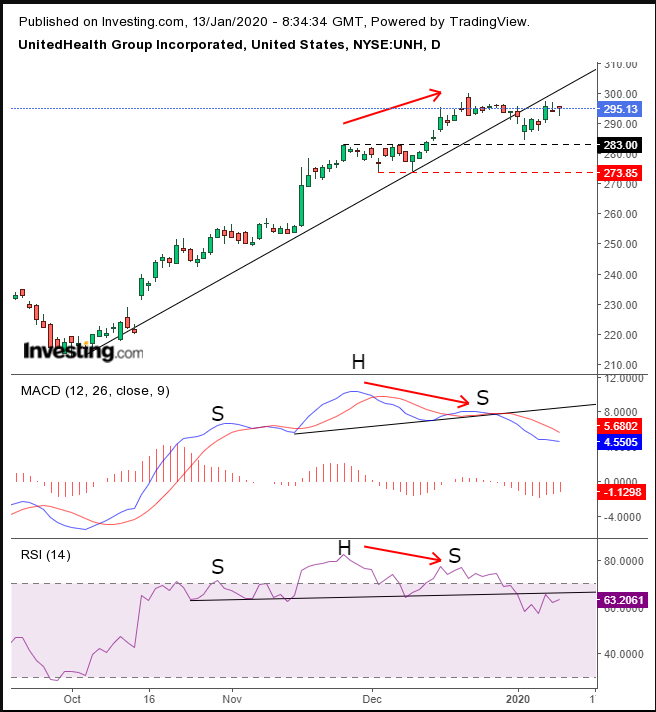
UnitedHealth Group (NYSE:UNH) is scheduled to release corporate results on Wednesday Jan. 15 before the market open. Analysts forecast EPS of $3.77 vs $3.21 and revenue of $60.93 billion vs $57.98B for the same quarter last year. That’s an improvement in EPS of roughly 15% and around 5% growth in earnings per share.
In the last 27 quarters, EPS beat forecasts 26 times and met expectations once in 2013. Revenues however, disappointed three times in the same period.
Providing health coverage for over 49 million people, the company is the biggest U.S. insurer. Its shares have gained over 30% since October — hitting an all-time high — after beating expectations in its third-quarter earnings and hiking its growth forecast for this year.
While most analysts expect these trends to continue, we note some warning signs.

The price dropped below its uptrend line since Oct. 3, falling away from the record. While, in itself that is a natural downward correction after a momentous gain, as investors lock in profits, the MACD and RSI — both — provide negative divergences.
While the price rose between Nov. 25 and Dec. 20, both the MACD and RSI fell. The first demonstrates that despite the increase, the price still slowed its ascent compared to other periods, while the RSI shows that momentum wasn’t backing up the incline for prices, suggesting the climb could lose steam.
Either of these indicators — each of which provide a signal of negative divergence — should give investors pause. Both doing so simultaneously should put traders on alert, seeing that both are structured differently. That is why they rarely confirm each other.
Not only did both indicators provide negative divergences, but they both completed H&S tops, further increasing the likelihood of a price reversal.
It’s noteworthy that the Dec. 20 all-time high was $300.00 on the nose, underscoring just how important the psychological association to whole numbers is. Emphasizing this point is the fact that the price fell away from its record high and closed at the very bottom of the session — and then proceeded to descend below the uptrend line.
Trading Strategies
Conservative traders would wait for the price to reverse, which may take place if the price falls below the Dec. 10 low of $274.01 (dotted red line).
Moderate traders may short with a close below the $283 level, whose support on Jan. 3 demonstrated its significance, after having been a resistance from Nov. 25 through Dec 6.
Aggressive traders may short now.
Trade Sample
Entry: $297
Stop-Loss: $301
Risk: $4
Target: $285, above the Jan. 3 low.
Reward: $12
Risk:Reward: 1:3
