WTI Crude dropped 2.43% Wednesday and 3.46% from the day's high after U.S. stockpiles climbed for the 10th-straight week and Saudi Arabia said it will not curb output unless other oil-producing countries also rein in their supply levels. Russia's President Vladimir Putin later added fuel to the fire by indicating that he’s comfortable with current prices. Still, yesterday’s price closed at $50.29, above the key psychological $50 level, with the day's low also holding above that critical mark at $50.06.
This morning, WTI prices temporarily yielded to downward pressure and slipped below the $50 support for the first time since October 2017, as demand retreated on concerns that OPEC would fail to significantly reduce output. But prices later bounced back on signals from Russia that it was leaning toward an output cut.

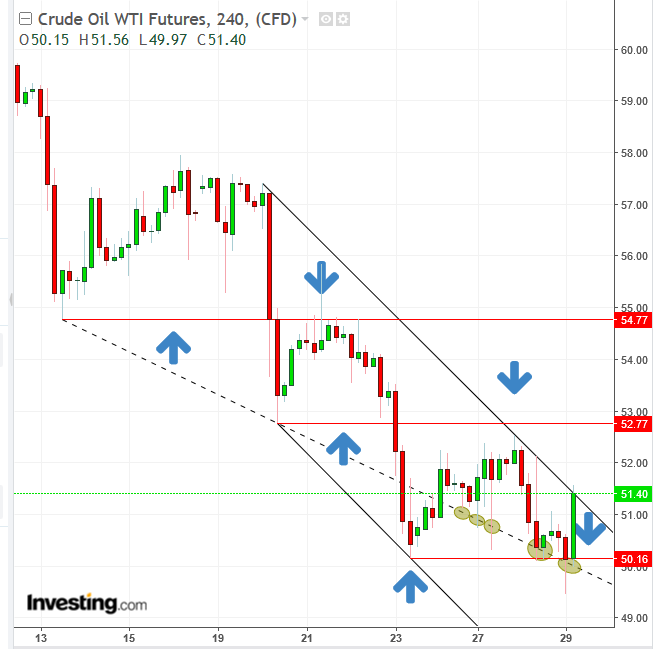
WTI has been trading within a descending channel for more than a week throughout the last two peaks and troughs. The price momentarily broke above the upper boundary of the descending channel this morning, found resistance and fell back below, ultimately confirming the integrity of the channel and providing a unique and ideal shorting opportunity from a risk-ratio perspective.
The advantage of this pattern over a less organized downtrend is that it sheds light on where clusters of buyers and sellers may be waiting, increasing the efficacy of entries and exits.
As you can see, the prior support (dotted) line, November 13 to November 20, failed as buyers demanded even lower prices and sellers were willing to give it to them. That agreement that prices should fall faster shifted the trajectory accordingly. Still, that support line still seems to rally demand, as you can see how many times the price bounces off it and even now, as we write these lines, it has been struggling precisely on that line.
But a more reliable technical measure of support and resistance - - the markers of supply and demand -- are peaks and troughs. As opposed to subjective rising and falling trend lines, peaks and troughs are objective. Trend lines don’t hold innate significance other than providing a general trajectory. Some technical traders trade off them, also influencing the momentary supply-demand balance and causing a temporary self-fulfilling prophecy.
Peaks and troughs, however, are constant. Even purist fundamental analysts pay attention to the price relative to yesterday's open, close, high and low. This awareness may impact their decision making, as opposed to trend lines, which change and therefore carry little significance for non-technical traders.
Once the $55 level support of mid-November fell through, it turned into resistance late in the month as traders remembered the previous fall and therefore considered the price too high. Then, when the lower trough $52 level was penetrated on November 20, it turned into a resistance when the market retested that level November 26-27. Earlier today, the November 23 $50 support level was breached. Should prices close below it in the near future, bears would be encouraged to keep selling and bulls may convert to bears, as those who are still undecided finally pick the bear side.
So, peaks and troughs can be used to establish entries and exits, while the channel provides the boundaries of a trade. Notice how the support and resistance of peaks and troughs flip once penetrated.
Trading Strategies
Conservative traders should wait for a 3% penetration - to rule out a bear trap - of the November 23 peak, followed by a return move to confirm the integrity of the low-resistance with at least one long, red candle following a green or small candle of any color.
Moderate traders should wait for a 2% downside breakout and, depending on risk aversion, choose between waiting for resistance confirmation or an entry closer to the stop-loss and limiting exposure.
Aggressive traders may risk a short, taking advantage of the price's proximity to the channel's resistance for an exceptionally favorable risk-reward ratio.
Trade Sample
Entry: $51.00
Stop-loss: $51.60, above today's high
Risk: $0.40
Target 1: $49.50, above yesterday's low
Reward: $1.50
Risk-Reward Ratio: 1:4
Target 2: $48.50, 3% penetration of previous trough
Reward: $0.20
Risk-Reward Ratio: 1:6
