By Pinchas Cohen
Trade the Loonie Risk on the NAFTA Negotiations
On July 31, we provided a short trade on the loonie. Since then, the USD/CAD rose 2.25 percent or 280 pips up to Friday’s high. We now believe the pair will continue to rise, and it provides a most favorable risk-reward ratio to traders.
After much spectacle in the campaign on ripping up NAFTA, the Trump administration is set to arrive at Wednesday’s negotiations without much fanfare. Of course, two days is a very long time in a Trump administration, but for now – Trump is not making a lot of noise. Is it because his focus is on the bigger opponent in the East than those of the North, or is it that when it comes to actual bargaining, he knows to not show his cards?
Either way, this presents a significant risk to the US’s neighbor. Canada cannot pull off self-sufficiency. It has a small population on an expansive, resource-rich land. If it doesn’t trade, its consumers won’t be able to buy products they cannot produce at home or that would cost much more to produce locally which would hurt their wealth. Additionally, Canadian producers rely on exports to sell their products.
Trade makes up 53 percent of Canada’s GDP and a quarter of Canadian jobs – 4.7 million out of 18.8 million, as of 2014. If trade-dependent employment is included, that number grows to eight million – nearly half of all Canadian jobs.
Trump’s platform basis was his negotiation prowess. He needs to show everybody – and tweet about it – that he can do a better job than presidents in the last 23 years, by forming a better NAFTA agreement. The US trade deficit with Canada is $15.2 billion, or 5.42 percent. It makes Trump feels like a sucker, and he doesn’t like that feeling.
The Technicals

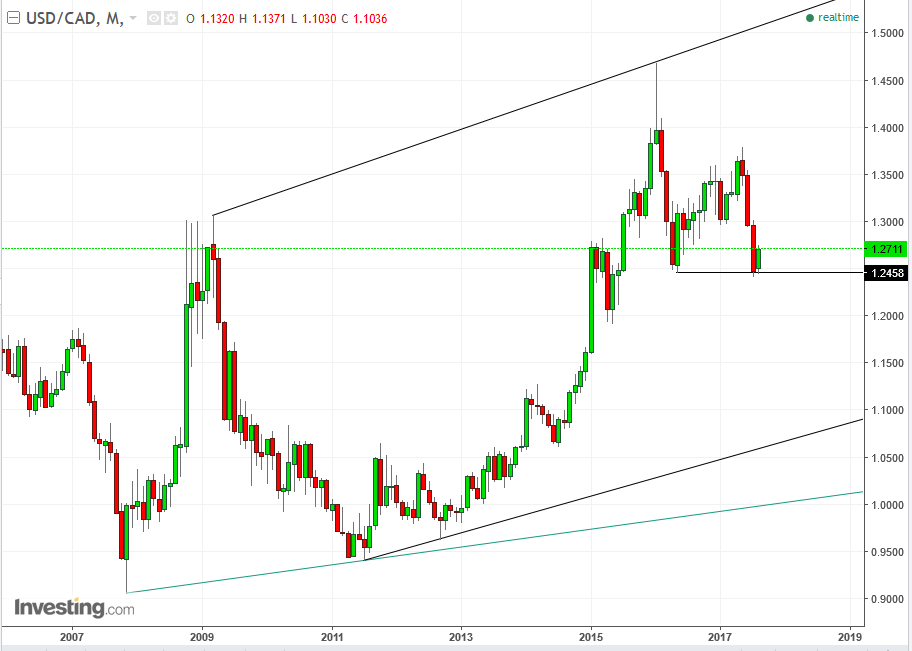
In the very long run, since November 2007, the CAD has been falling against the dollar.

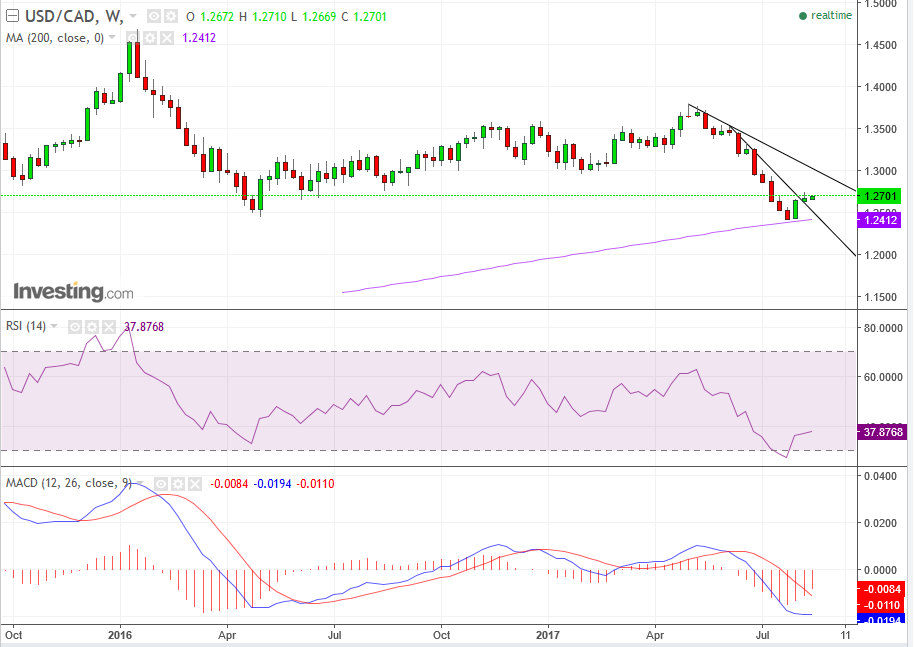
In the long run, since May 2016, the pair has been trading sideways. While in late June it crossed below its uptrend line since May 2015, it failed to cross below its early-May trough, suggesting that there are enough buyers here who remember the 10-percent rise till May and are outbidding the sellers. The price needs to decline below the 1.2458 May trough to create a second, lower trough, to have reversed the trend downward. Alternatively, the price needs to rise over 18-percent to overcome the January 2016 high of 1.4691 to register a continued uptrend.
From a risk-reward perspective – 18-percent potential advance, to 2-percent potential decline – it provides a 9:1 ratio in the trader’s favor.
From a technical standpoint, the price found support by June 24, with the 200 wma, where it rebounded, paring a two-week loss in one week. The RSI has fallen to 26.85, registering the most oversold condition since November 27, 2007, before the dollar came back with a vengeance after the 2008 crash, as the quintessential haven currency – even gaining against the yen and the swissie and gold.

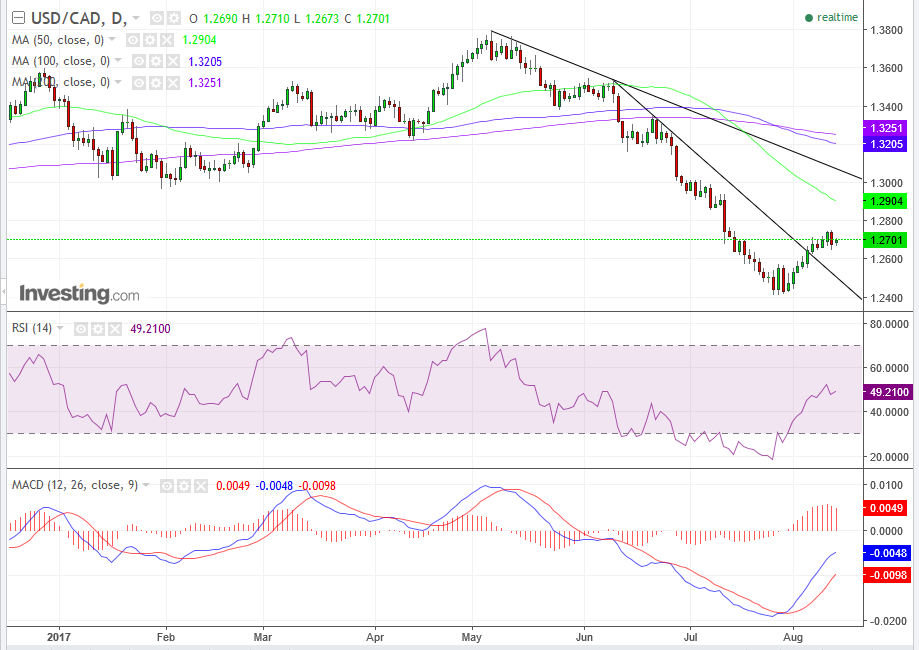
In the medium run, the pair has just crossed above its downtrend line since June 9. The MACD and the RSI both provided buy signals on July 31, after reaching extreme oversold conditions. For the MACD, it was the most extreme since March 2016, and for the RSI, registering a low of 18.0263, the lowest since May 2007.
Trading Strategies
Conservative traders would wait for a formal reversal, with two rising peaks and troughs.
Moderate traders might wait on a potential return-move to retest the 1.24 low, or at least the psychological 1.25 price level.
Aggressive traders may wait for a correction to 1.2648, last week’s low, which provided a support to Friday’s low, on the very pip. Alternatively, they may go long on a close above Friday’s 1.2754 high, as a sign of continuation.
Stop-Loss and Target-Price
Traders should only enter trades that provide favorable risk-reward ratios. A common mistake traders make is cutting their wins and running with their losses. Once they see a gain, they want to be able to say that they had a winning trade – of whatever magnitude – and jump out of the trade. And, they feel that if they don’t close a losing trade it’s not really a loss, as they continually get pulled into an ever-deepening hole, while convincing themselves it will turn around.
Traders need to both cover their trading expenses, as well as losses, before a gain can be considered a profit. Therefore, the classic risk-reward ratio is a minimum 3:1. That means that if the trade worked out, the trade won at least three times what he was willing to risk. Therefore, stop losses should be set according to price targets, while including the technical realities of support and resistance.
Long Stop-Loss and Target-Price
Stop-loss: below 1.24. Potential risk, depending on price at entry, can be up to 2.4-percent, or 300 pips, from the current price. Therefore, the price target should be at least 900 pips, to 1.36. Considering it took two months for the price to decline from that height to the current level, the trader should prepare to wait that long before exit, or not enter it according to these parameters.
Medium Stop-Loss and Target-Price
Stop-loss: below 1.25. Potential risk, 1.6 percent, or 200 pips. Therefore, the price target of a 600 pip-movement from the current price is 1.33. Considering it took 3 weeks for the price to move that distance coming down, a trader should not enter the trade, unless he’s willing to wait at least that long.
Short Stop-Loss and Target-Price
Stop-loss: below 1.2648. Potential risk, 0.47 percent or 60 pips. Therefore, the 180 pip-move will make the price target 1.2890. It took only 2 days for the price to make that move on the way down, but of course that doesn’t necessitate it will take as little to make that going up.
