Iron ore slipped today after the world's largest producer of the base metal, Brazilian miner Vale (NYSE:VALE), said a court ruling has given it a green light to restart production at one of its biggest mines, alleviating concerns over tightening global supply. The Brucutu mine was ordered closed in February after the Brumadinho dam collapse in January that killed more than 300 people.
However, operations have yet to resume pending additional regulatory approval from local authorities. Meanwhile, the price of iron ore, which initially dropped in the wake of the disaster, rebounded solidly as concerns of global supply constraints caused by the closure boosted the price.
Re-opening the mine is expected to dampen price pressures as these fears retreat, but we don't think they will. Based on the supply-demand balance, we believe the price of iron ore will continue to rise.

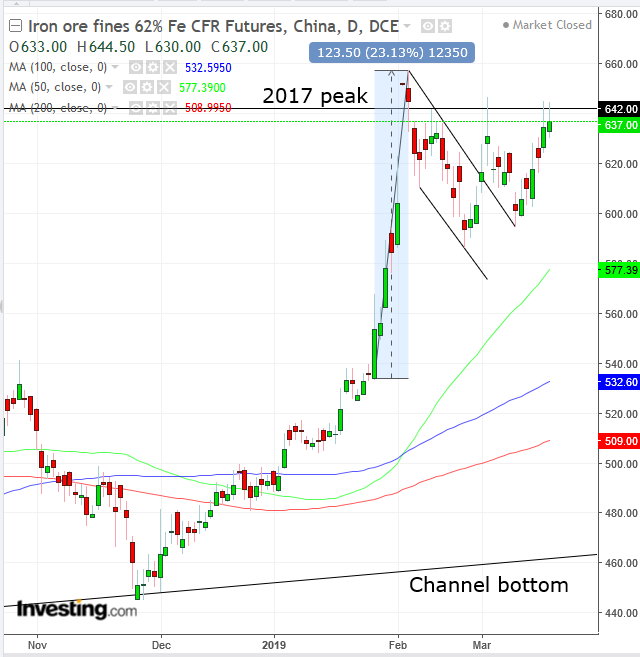
The price is currently the highest since Feb. 12 and showing the upside breakout of a well-defined bearish flag, bullish following the over 23% surge of the metal in only seven sessions. Already yesterday, the price closed above the initial break-out penetrative rally, allowing traders to increase their comfort level with the pattern's integrity.
On March 11, the rate reached a low of 594.50, where it touched the flag-top. It has been climbing since, demonstrating its support.
The flag pattern developed within a long-term, massive ascending channel since the Dec. 2015 bottom, projecting the supply-demand dynamics as prices tried to overcome the previous peak at the 640 level, during February and March 2017.
The pattern's target implication is seen by measuring the sharp move before the congestion. We have noted the bottom of the move to be absent of any congestion which may suggest an exchange between buyers and sellers. Therefore, we measured from Jan. 8 to the highest point of the flag-pole, and the beginning of the pattern's development, on Feb. 11, a move of more than 20% in seven sessions. However targets measure the price, CNY118, or over $17, from the breakout point of 616.
Trading Strategies
Conservative traders will wait for a new peak to be formed, higher than the Feb. 12, 657.50, to determine if the uptrend remains intact. Then they would wait for a correction that would stay above the 642 level.
Moderate traders might be content with a new peak and wait for the pullback for a better entry, not necessarily for proof of trend.
Aggressive traders may risk a long position now, providing they understand the risks and trade accordingly.
Trade Sample
- Entry: 635
- Stop-Loss: 630, the day’s low
- Risk: 5
- Target: 685
- Reward: 50
- Risk-Reward-Ratio: 1:10
