Yesterday was May the Fourth, the traditional release date of Star War films. But even when there's no new release pending—as was the case yesterday—fans refer to the date as Star Wars Day, chosen because it's an artful play on “May the Force Be With You,” an oft-repeated salutation by key characters in the Disney film franchise.
Ironically, however, Monday’s trading proved that the share demand force is not necessarily with Disney (NYSE:DIS) right now, ahead of the entertainment giant's Q2 2020 earnings report, released today, after the market close.
One might be inclined to blame the broader selloff seen yesterday in early Wall Street trade before indices turned higher. However, the real reason is more specific: the stock was pressured after MoffettNathanson analyst Michael Nathanson downgraded Disney shares from a buy to neutral. He believes the economic impact of the lockdown is not yet priced in. The company's theme parks have been closed for months and the historically high unemployment now being seen in the US is not likely to drive increased demand for vacations.

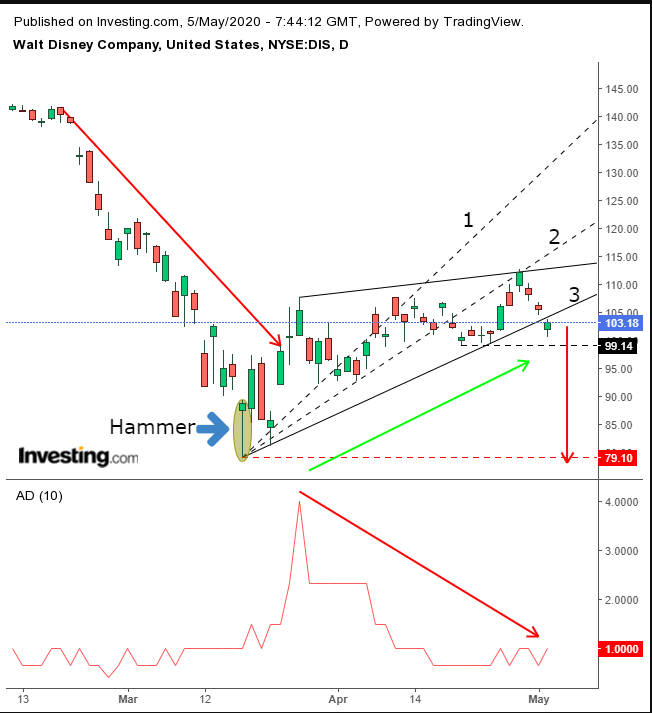
The stock’s price fell 2.2% yesterday, providing a downside breakout to a rising wedge. This is a continuation pattern. Its break, therefore, is expected to resume the underlying downtrend since the February high.
Rising wedges are common in a bear market, especially after the first leg down. A rising wedge is an illustration of spurned hopes. Buyers buy and buy, but rather than rising more steeply, the uptrend flattens, until it deteriorates completely with a downside breakout—demonstrating the lack of structural demand.
To clarify, while Disney’s supply-demand balance has shifted, the broader market is suffering from a similar fate. Note the negative divergence between the advance in price, within the rising wedge, and the falling market participation, as represented in the Advance-Decline Line. After the initial spark of demand upon hitting the March 18 low—as presented by the hammer—interest petered out.
Note the repeatedly broken uptrend (dotted) lines, till the bottom of the rising wedge, the third dotted line. This repeated redrawing of the trend lines is called “fanning.” The third broken one signals a reversal, as disappointed buyers give up while encouraged sellers grow bolder.
Trading Strategies
Conservative traders would wait for confirmation, with the price falling below the congestion of April 21-24, beneath 99.00, and wait for the likely return move, till positions and portfolios are updated to the new, presumed reality as portrayed by a rising wedge.
Moderate traders will wait for the same fall below 99.00—to avoid a bear trap—then possibly for the pattern retest, for a better entry, not necessarily for confirmation of the rising wedge’s integrity.
Aggressive traders may short now, after having written a cohesive trading plan, since those who stick to it increase their odds of survival.
Trade Sample
Entry: $102 (after hours quote)
Stop-Loss: $109
Risk: $7
Target: $81, above round number of presumed support of March low, which spiked participation
Reward: $21
Risk:Reward Ratio: 1:3
