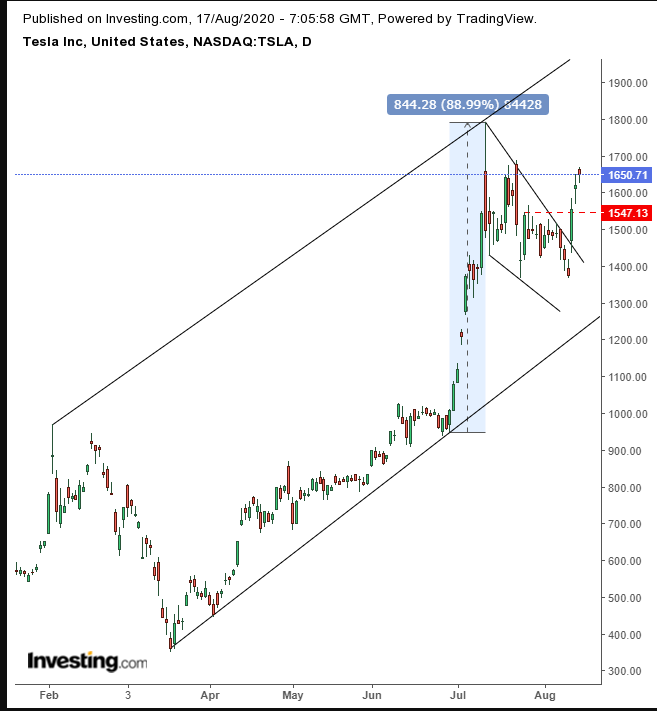
Shares of electric vehicle maker Tesla (NASDAQ:TSLA) notched a new record on Friday, closing at $1,650.71, after both Bank of America and Morgan Stanley upgraded their ratings on the Palo Alto, California-based car manufacturer.
Bank of America elevated the stock from Hold to Buy and Morgan Stanley, which had downgraded the stock in June due to the brewing US-China trade war, lifted its Sell rating to Hold. As well, Bank of America nearly doubled its price target to $1,750 from $800, reasoning that the higher the stock goes, the easier it is for Elon Musk to get low cost funding, whether the company meets all its production targets or not.
Adding to the stock's appeal, last week, Tesla announced a 5-for-1 split, which would make the increasingly expensive stock—which nearly quadrupled in value this year—more affordable for retail investors wanting to gain a stake in the company, something that tends to boost the stock further, on newfound demand.
Technicals not only support Bank of America’s new price level but imply a much higher target, $2,294.

Trading completed a falling flag, bullish after the $844 surge in the two weeks between June 29 and July 13. The reason the flag is falling? Happy traders cashed out.
But the upside breakout was made by new bulls, who also want to rake in the kind of returns made by early bulls. The topside breakout demonstrates that buyers are willing to up their bids to find new willing sellers at higher prices.
The flagpole—the jump before prices ranged within the flag’s body—is the implied target of the flag’s breakout. Therefore, a $644 climb from the $1,460 point of breakout suggests a price target of $2,294.
Beware, however, of Thursday’s High Wave candle—a sign of bewilderment—followed by a small Hanging Man, a potential setup for forced long liquidations, which would be confirmed with a lower close. Should confirmation follow today, it would suggest the high probability of a return move to retest the pattern, coinciding with the bottom of the rising channel.
A successful show of demand would propel the prices toward our targets.
Trading Strategies
Conservative traders should wait for proof the uptrend remains intact, via a pullback that successfully retests the integrity of the two patterns, the falling flag and the rising channel.
Moderate traders may wait for the presumed buying dip, but not necessarily wait for confirmation of trend.
Aggressive traders may enter a contrarian short, in an effort to capture the move down before joining the remainder of the market on the continued uptrend. It is advisable to wait for the Hanging Man’s confirmation.
Contrarian Trade Sample – Aggressive Short
Entry: $1,650 – upon a rally that follows a lower-closing Hanging-Man confirmation
Stop-Loss: $1,670 – above the Hanging Man
Risk: $20
Target: $,1550 – above recent congestion atop the $1,500 round psychological number
Reward: $100
Risk:Reward Ratio: 1:5
