For years, Southwest Airlines (NYSE:LUV) was lauded as one of the most profitable airlines in the industry. But yesterday, its Q1 2020 earnings release indicated the US's largest domestic carrier had suffered its first operating loss since 2009, after COVID-19 grounded its fleet.
However, plans for augmenting revenue, detailed during the conference call—to restart operations as well as the company raising $4 billion by selling shares and convertible notes—boosted the stock yesterday by 2%; it closed at $29.69. The gains continued in afterhours trading, when shares rose another 1.1% to $30.01.
Nevertheless, according to the Wall Street Journal, during the call CEO Gary Kelly also said, “realistically we just can’t expect that things are going to be back to normal in six or 12 months.” Indeed, Southwest estimated that operating revenue would be down as much as 95% in April from a year earlier, with planes flying just 6% full on average. And May would likely be similar.
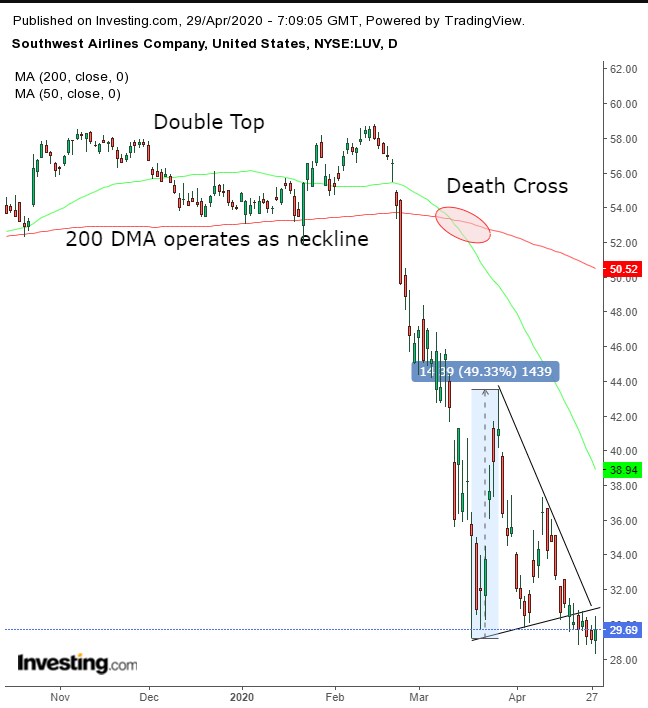
Considering the company itself said they don’t expect the trend to improve in the next quarter, we don’t expect much room for improvement in the share price as well. Furthermore, the supply-demand balance suggests the stock is heading lower.

The stock provided a downside breakout to a triangle on April 21. The pattern’s lines converge as a symmetrical triangle, which portrays price equilibrium. However, its top is far steeper than its bottom, suggesting the dynamics within are probably more aligned with those of a Descending Triangle, where bears dominate the trade.
Either way, even if the pattern is operating as a symmetrical triangle, which is expected to be neutral, it's following the 30% plunge from its Feb. 14 high to its March 18 low, suggesting prices would continue lower. Indeed, the downside breakout demonstrates that supply overwhelmed demand, forcing sellers to lower offering prices as they searched for new, willing buyers.
While a descending triangle may have more bearish energy, in this context, a symmetrical triangle is bearish as well.
Measuring A Pattern
The implied target for shares is reached by measuring the height of the pattern, which here is $14.33, suggesting a target in this case of about $16.
Calculation:
- Point of breakout: $30.60 - $14.33 pattern height = $16.27.
This is a theoretical objective however. Traders should always look at the whole map.
Trading Strategies
Conservative traders would wait for a return move to retest the bearishness of the triangle, with at least a long, red candle falling away from the pattern.
Moderate traders may wait for a rally, as well, but not necessarily for pattern confirmation, just for a better entry.
Aggressive traders may short at will, providing they worked out their risk:reward ratio and it suits their account and temperament.
Trade Sample
Entry: $30
Stop-Loss: $31
Risk: $1
Target: $25
Reward: $5
Risk:Reward Ratio: 1:5
