As a petrocurrency, or the currency of an oil-exporting country, the Russian ruble is inextricably linked to the price of oil. And, with the weekend's shock attack on Saudi Arabian oil fields likely to result in the Middle Eastern country's production being halved for weeks or months to come, the ruble is set to surge along with with the price of black gold.
The energy sector’s impact on the Russian economy is huge, making up 59% of the country's GDP. The higher trajectory for oil prices could help support a stagnant Russian economy: increased oil prices give the government more leeway to raise public consumption, a much-needed prop to gross domestic product given a sharp drop off in private investment in recent years. It would also pad the central bank's foreign reserves and give comfort to foreign investors in the government bond market.
The World Bank cut its forecast for Russia’s GDP growth this year to 1.4% from the previous 1.5% in early April. Now, new expectations that the economy may expand along with the energy sector are likely to give an additional boost to the ruble.

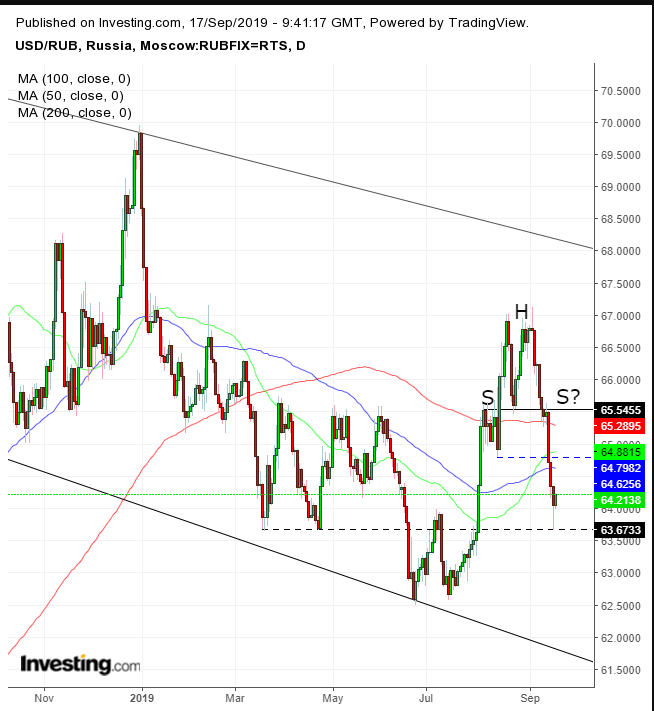
The dollar rebounded today against the ruble after a three day drop of 2.22% after the attack on Saudi oil facilities. The ruble’s weakness correlates to that of oil, and we consider it temporary amid a technical correction – profit-taking and gauging the playing field.
Note, the price rebounded yesterday from precisely the same level as the March and April lows. Presumably, traders remembered that prices jumped 3% for the ruble and double digits for oil during that period.
From a technical perspective, there is room for an upward correction after the August-September double top — the neckline of which coincides with the 200 DMA. This could also be developing a H&S top, with the right shoulder bottom marked by a blue dotted line. Whichever the top, it developed near the top of a falling channel since September, reinforcing a downward path for the dollar versus the ruble.
Trading Strategies
Conservative traders are likely to wait for a full return move followed by evidence of oversupply, with a rally ending with at least one long red candle engulfing a green or small candle of either color.
Moderate traders may wait for the return move for a better entry but not necessarily for proof of trend integrity.
Aggressive traders may enter a contrarian long position, hoping to ride the bounce – providing they understand the risk and have preset a trade plan that fits their budget.
Trade Sample – Long Position Setup
