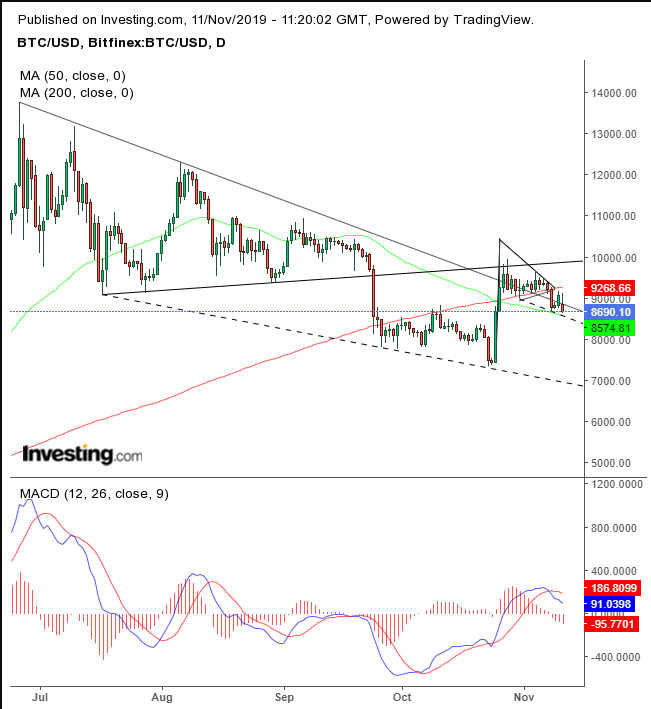
Bitcoin is sinking, despite two strong endorsements today for the popular cryptocurrency, amid a risk-off environment currently weighing on markets—wherein some analysts see the digital currency as a haven. So, why the slump?
The upbeat news, from China's state-run newspaper Xinhua, referred to Bitcoin as the "first successful application of blockchain;" as well as from a just released Forbes piece which reported that David Marcus, head of cryptocurrency projects at Facebook (NASDAQ:FB) is "surprisingly bullish on Bitcoin," considering it to be "digital gold," may both have been backhanded compliments. Still, Bitcoin is down 1.9%, after being up 3.15%. That’s a 5% reversal.
Perhaps the drop is related to Xinhua also saying in the same article that Bitcoin is unstable, with most transactions taking place on the black market. Or maybe additional remarks by Facebook's Marcus, mentioned at the same time as the positive opinion are what's weighing on the digital currency: "I don't think of Bitcoin as a currency, it's actually not a great medium of exchange because of its volatility."
More straightforward, perhaps are the technicals, which aren't in any way bullish right now.

We've been bearish on Bitcoin since July’s double top. That view was reinforced by October's descending triangle completion.
The digital currency proceeded with a return move, retested the symmetrical triangle’s resistance with an extremely long upper shadow above the triangle, but the price ultimately closed below the pattern, confirming its integrity, as supply overcame demand. Since then, the price has been consolidating within a pennant formation, particularly potent with the 200 DMA as its bottom—which, after the preceding 40% surge over the two day period from Oct. 25 to 26—suggested continued upside movement.
Today’s fall, however, back below the triangle’s downtrend line, the 200 DMA, the pennant’s bottom and the preceding low on Nov. 8, all suggest a pattern failure for the pennant. Failures tend to throw the price in the opposite direction, as traders scramble to readjust positions in order to get on the right side of the trend.
The MACD’s shorter MA fell below its longer MA, suggesting the price breakdown is broad and therefore representative of a shift.
Trading Strategies – Short Position Setup
Conservative traders are likely to wait for a new low since the late-June high at the $14,000 level, to reestablish the downtrend.
Moderate traders should wait for the price to close below the psychological $8,500 level, to ensure the Nov. 8 low is broken, which found support above the late September-October range.
Aggressive traders may short as soon as they formulate an appropriate trading plan.
Trade Sample
Entry: $9,000
Stop-Loss: $9,300 — above the 200 DMA, which forms the bottom of the pennant
Risk: $300
Target: $8,100
Reward: $900
Risk:Reward Ratio: 1:3
Note: This is just a sample. Successful trading is measured by overall results.
