Yesterday's better than anticipated API crude inventories report turned the oil market upside down. Analysts called for an 890,000 barrel build. Traders set their positions accordingly.
The release, when it was announced, instead showed a drawdown of 8.01 million barrels for last week. A short squeeze ensued, pushing prices of WTI up toward $39. This boost, however, might be short-lived, based on the technical chart.

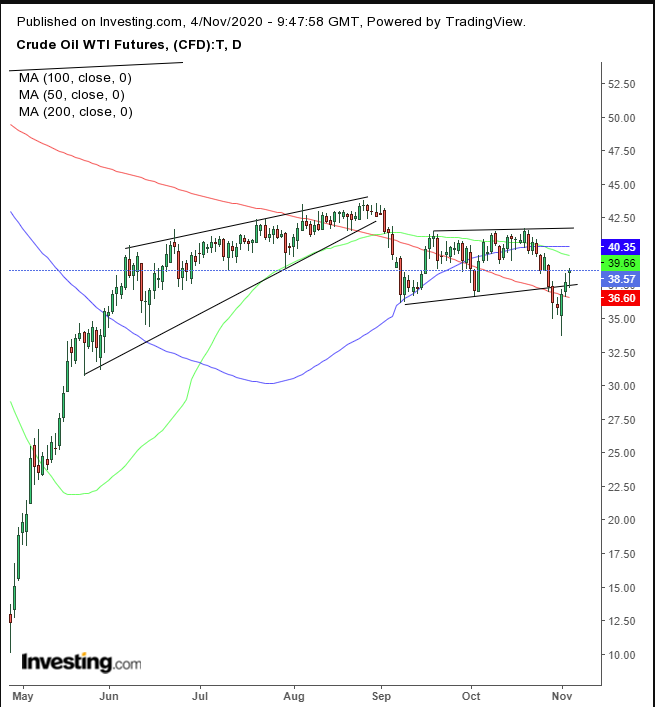
We've often written about oil's rising wedge, in play from mid-May until the end of August, bearish after a climactic and therefore unsustainable rally. And indeed, afterward, the price of the commodity traded within a range that was expected to break to the downside. That happened last Thursday.
Now, what should traders expect with the price having jumped back into the range?
Today’s trading developed a hanging man, at least currently, though only the closing price counts for the final formation. Even so, for the bearish nature of the move to seep through, confirmation is required—a follow-up candle whose close is below the hanging man’s real body, leaving buyers who saw the bounce of hanging man off its lows to note that it will continue hanging.
The following decline would force them to liquidate positions, pushing the price even lower. Of course, this would only occur if the hanging man remains in place on a closing basis, followed by the confirmation.
If that happens, at the bottom of a range, it’s reasonable to expect the range bottom to maintain its resistance, along with the 200 DMA which has been on that side for almost the entire year.
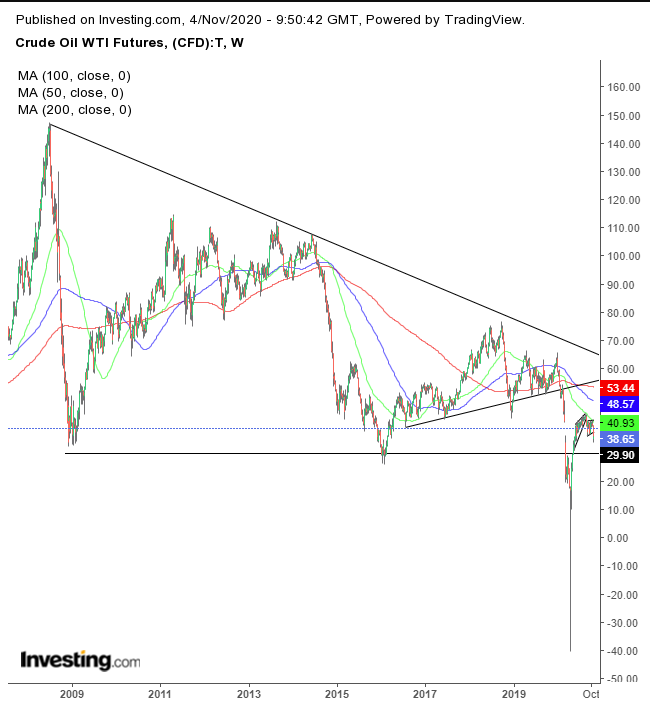
We are also bearish over the longer term, based on the 12-year weekly chart.

The commodity's price has been in a downtrend since the 2008 high. More recently, the weekly price developed a massive H&S continuation pattern, since June 2016 till February 2020. The downside penetration formed the third long-term low since 2009.
Trading Strategies
Conservative traders should wait for the price to fall back below the 200 DMA, with a 3%, 3-day filter to avoid a bear trap, followed by a return move that verifies the pattern’s integrity, before risking a short.
Moderate traders would be content with a 2% downside breakout and a corrective rally for a better entry, not necessarily for proof of trend.
Aggressive traders may risk a short upon the hanging man’s confirmation.
Trade Sample
Entry: $38
Stop-Loss: $39
Risk: $1
Target: $34
Reward: $4
Risk:Reward Ratio:1:4
