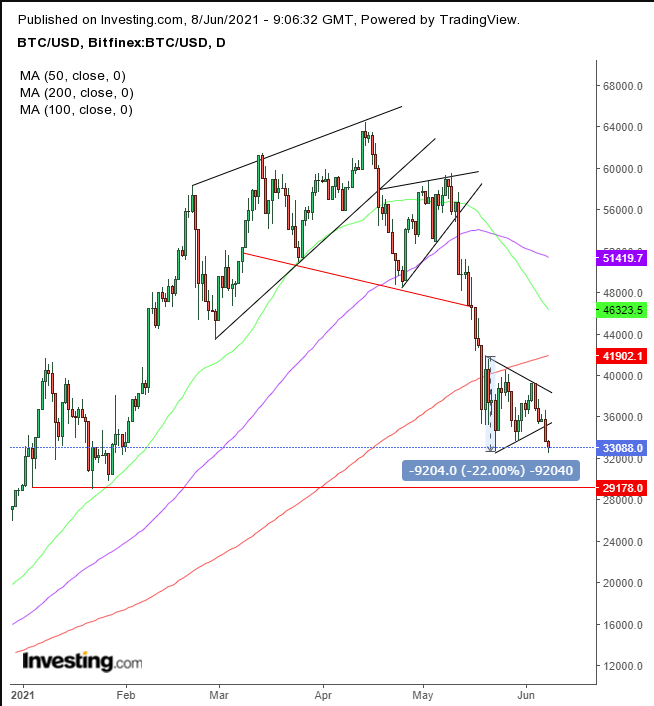
Bitcoin is falling for the fourth day out of five and has reached a four-and-a-half month low. There are a number of possible drivers:
- The possibility of changing monetary policy in the US;
- Restrictive cryptocurrency regulations in China;
- Tesla's (NASDAQ:TSLA) flip flop on accepting the cryptocurrency as a means of payment;
- And more recently, former President Donald Trump’s characterizing the leading digital coin as a “scam against the dollar” that needs to be “very highly regulated.”
But there is a fundamental reason that the cryptocurrency's price could move higher—the possibility that the Federal Reserve will have to unwind its bloated balance sheet. Although Skybridge Capital, a $7.5 billion hedge fund with a Bitcoin holding in excess of $310 million, argues that Bitcoin and gold are resilient and will not be affected by tapering of US monetary policy.
Still, Germany’s largest lender, Deustche Bank, says America could be facing the worst inflation in history due to the recent unprecedented government spending and ultra-loose monetary policy. The bank predicts the kind of inflation we haven’t seen since the 1940s or 1970s. Higher inflation reduces the buying-power of the dollar, a catalyst for an exodus out of the dollar and into havens, like Bitcoin.

Bitcoin extended a downside breakout of a bearish wedge for the second day, though it is now trading off session lows. The pattern penetration suggests that all available demand fizzled out, leading sellers to lower bids in the hopes of finding new, willing, and more discerning buyers.
The completion of such a pattern tends to set in motion a chain reaction, filled with stopped out longs and triggered shorts, which attract the broader market to jump on what is now a recognizable downtrend. If this scenario plays itself out, it will test our recent bullish call. A fall below $29,000 will reverse our position to medium-term bearish.
Following the principles of technical analysis, we expect the price to fall, at least to the $29.000 level. The range’s duration of three weeks says it’s a pennant; a brief pause in the trend.
The implied target is measured by the preceding move, which is almost $27,000. However, given that that would almost erase Bitcoin’s value—returning it to $12,000—and being mindful of this asset's wide swings, we’ll consider the range to be a symmetrical triangle—a period of supply and demand equilibrium— whose measuring is its height, or a presumed $9,000 move lower from the point of breakout.
However, even if this more conservative target is actualized, putting it at $26,000, it will have decimated the $29,000 support we have been relying on for our previous, bullish call.
One thing is for sure, we can expect a wild ride, so hold on tight.
Trading Strategies
Conservative traders should wait for the $29,000 to give way, before considering a short.
Moderate traders could short if the price completes a return move that evidences continued supply by the pattern.
Aggressive traders could short at will, according to a preset trading plan that incorporates their timing, budget and risk-tolerance. Here’s an example:
Trade Sample
- Entry: $35,000
- Stop-Loss: $36,000
- Risk: $1,000
- Target: $30,000
- Reward: $5,000
- Risk-Reward Ratio: 1:5
Which stock should you buy in your very next trade?
With valuations skyrocketing in 2024, many investors are uneasy putting more money into stocks. Unsure where to invest next? Get access to our proven portfolios and discover high-potential opportunities.
In 2024 alone, ProPicks AI identified 2 stocks that surged over 150%, 4 additional stocks that leaped over 30%, and 3 more that climbed over 25%. That's an impressive track record.
With portfolios tailored for Dow stocks, S&P stocks, Tech stocks, and Mid Cap stocks, you can explore various wealth-building strategies.

