Shares of McDonald’s (NYSE:MCD), the world's largest fast food restaurant chain, surged in premarket trading on Monday, gaining 6.2% after the company reported better than expected Q3 2020 results. The Chicago-based company also announced it will be raising its dividend.
The mega cap purveyor of Big Macs, Chicken McNuggets and french fries among other menu items, posted an adjusted earnings per share of $2.22, surpassing the consensus $1.91 EPS. Revenue did a little better than estimated. While comparable store sales fell 2.2% around the world, they increased 4.6% in the US, as domestic customers—able to pick up orders or have them delivered as well as eating on-site but outdoors—were less restricted than consumers in other countries where lockdown measures were more severe.
But, after the stock opened 4.8% higher on Monday, it closed down 1.5%, in the red at the end of the day's trade. Given that Monday was also the day markets vaulted higher after the announcement of the Pfizer and BioNTech's potential coronavirus vaccine breakthrough, it's hard to understand why the stock of such a high-profile restaurant chain, which would benefit from any COVID-19 therapy, would experience such a drastic about-face.
It isn’t convincing that markets may have been reacting to McDonald's disappointing global numbers, since those were overshadowed by domestic gains. Also difficult to believe is that the higher fixed costs management spoke of on the conference call should be so dramatic as to turn a huge advance into a decline.
Perhaps investors were focused on cyclical stocks, at the expense of equities that could be considered good, long-term, fixed income buying opportunities. Or perhaps the technical chart provides the elusive reason.

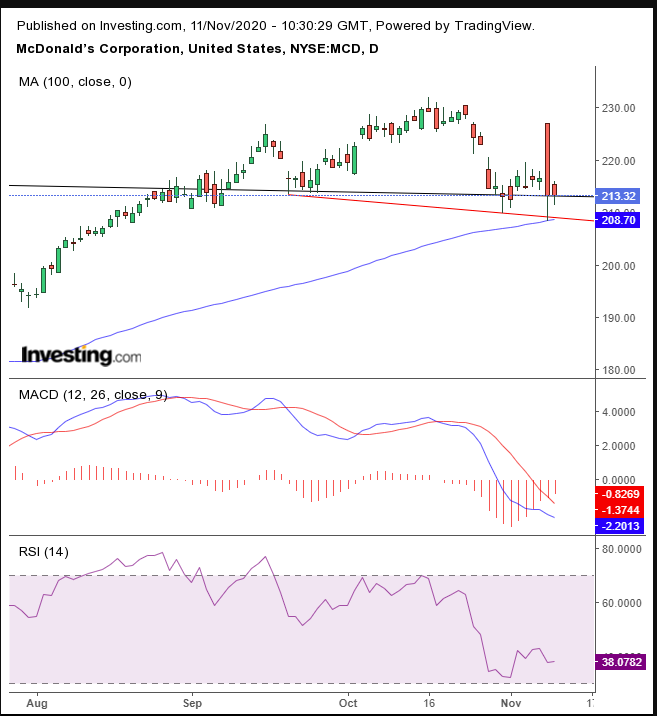
On the daily chart, the price may be developing a down-sloping H&S top, complete only with a downside breakout of the neckline, which is difficult, as it recedes. While this may be a short-term play, the supporting 100 DMA and RSI bounce from the oversold level offer evidence countering such a move, though it could still be possible. That could provide a narrow reason why shares reversed at the end of Monday's trading
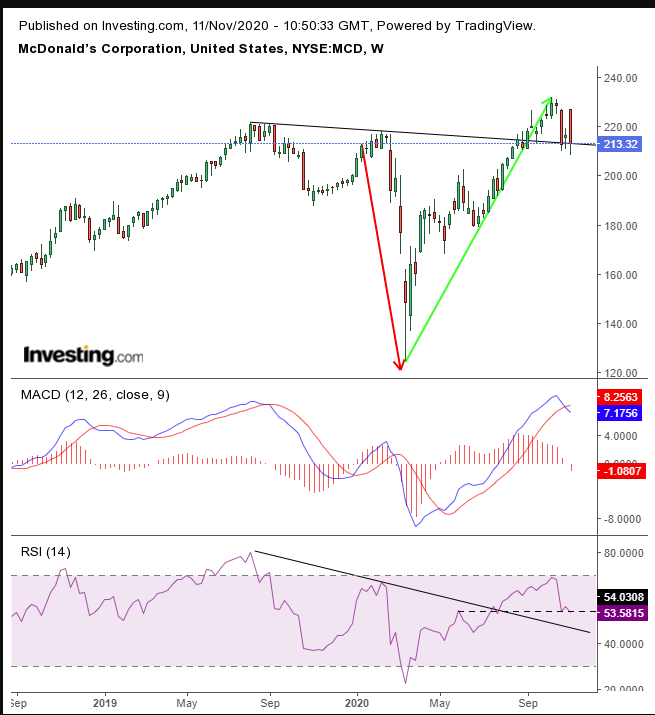
However, it's the longer view that's much more interesting. Here's the weekly chart:

Check out that sharp V-bottom. What’s more, see how the neckline propped up the price, demonstrating support. While the daily, two-month long chart also shows the same neckline, a proper H&S is at least three months long. As such, there should be lots more interest in a pattern that’s nine months long, whose support-resistance line also fits in with the August-September 2019 peak.
A cautionary observation, however: The MACD provided a bearish cross, and the RSI fell away from its February high, having reached the oversold, 70 level. Nonetheless, we’re encouraged by its upside breakout, corresponding to that of the price.
Similarly, it appears to have found support. This is a trade based on the weight of the evidence, along with our personal, subjective interpretation, which is rooted in our experience. Technical analysis is not purely a science. It's also infused with art—a skill developed by an “eye.” Seldom do all the stars line up for an “ideal” trade. Therefore, money management is the critical component for successful trading.
Trading Strategies
Conservative traders should wait for a new high, above the Oct. 16 record peak, for the small H&S to blow out, itself turning bullish and adding to the explosive upward market mechanics. However, first, they’d wait for a return move to confirm support.
Moderate traders can follow the same course as their more cautious peers and wait for a pullback for a better entry, if not for proof of trend.
Aggressive traders may enter a long position now, provided they work out their risk and reward and commit to a coherent trading plan that allows them to get on the side of statistics. Here’s an example.
Trade Sample
- Entry: $210
- Stop-Loss: $208 – below Monday’s low
- Risk: $2
- Target: $230
- Reward: $20
- Risk:Reward Ratio: 1:10
Author's Note: This is a trade sample, not a prediction. The analysis, above isn't a prophecy either. It's based on the preponderance of the evidence in the body of the text, but the outcome is never guaranteed. The sample is generic and merely designed to display the salient points of a coherent trading plan, without which there is absolutely no hope for ongoing successful trading. Fine tune the parameters to fit your timing, budget and temperament. If you don’t know how to do that, start small, so you can learn with experience. Otherwise, you’re just gambling. Good trading!
