Are investors being overly confident about the ECB’s path to stimulus ahead of the central bank's policy meeting tomorrow?
The European Central Bank faces a troubling dilemma. The euro zone economy has been contracting for the last year, but it’s doubtful how much positive impact any further easing could have when financial conditions are already so loose. And any further loosening is sure to incur the ire of U.S. President Donald Trump, who has accused the ECB of attempting to soften the euro to gain unfair trade advantages over the U.S.
Even so, outgoing ECB President Mario Draghi said in June that further stimulus might be necessary if the economy falls short of posting a stronger performance. Data released since then has showed little sign of recovery. But the bank’s firepower is widely considered depleted. So, will Draghi fire a surprise bullet from the chamber?
Consensus forecasts expect further easing in September, but any hints from tomorrow's meeting about what may happen are sure to weigh on the common currency, while boosting equities. Especially if the ECB fuels growth across Europe by buying stocks, as it reaches the limit of available bonds.

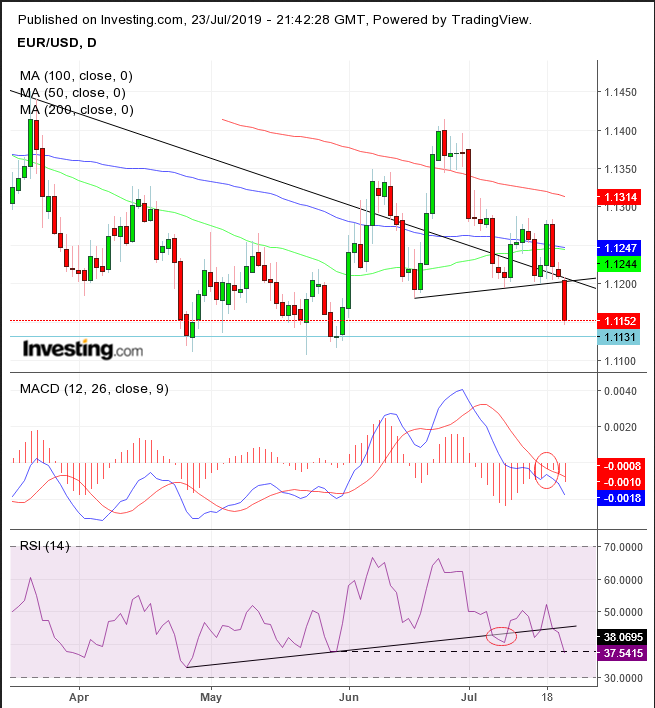
The euro provided a downside breakout of a H&S continuation pattern, resuming the underlying downtrend since April 2018. The pattern dropped the common currency back below its downtrend line since Jan. 10, the significance of which is underlined by the 200 DMA. The pattern developed after the famous MA forced the price back down on July 1, forming the head of the pattern. The price is 0.19% from its May 29 bottom, which was the lowest in the two years from May 18, 2017.
The MACD reinforced its bearish view as the short MA found resistance below the long MA, even before the single currency’s continuation pattern’s completion. As a leading indicator, the RSI gave investors a heads up even earlier, when it fell below its uptrend line in early July. It also fell below its May low, suggesting prices will go on to post a new, multi-year low.
On the weekly chart, in a rare formation, the 200-week MA also provided a resistance in the first week of July. The agreement between the daily and weekly 200 MA is noteworthy, as it suggests that the shorter and longer term are synchronizing – both as a resistance. Additionally, the 50-week MA has fallen to the top of the 200-week MA.
A fall below the May support may pull the 50 below the 200, triggering a long-term Death Cross, a potential catalyst for a long-term downtrend. The last time the weekly averages triggered a death cross was December 2014: the euro plunged 16% in the three months between Dec. 8, 2014 and March 9, 2015.
Trading Strategies
Conservative traders are likely to wait for a confirmation of a continued downtrend with a 3% penetration of the H&S neckline to 1,0860, to filter out a bear trap.
Moderate traders would wait for a new low below May’s, followed by a return move that would find resistance, before risking a short position.
Aggressive traders could already be shorting now.
Trade Sample
- Entry: 1.1150
- Stop-Loss: 1.1200
- Risk: 50 pips
- Target: 1.1000
- Reward: 150 pips
- Risk-Reward Ratio: 1:3
