Google (NASDAQ:GOOGL) released its first quarter results yesterday and the stock instantly soared 3 percent on the headline beat, both on the top and bottom lines.
However, when investors got down to deciphering the fine print, they realized that those lines had been artificially stretched, with the help of two changes that had nothing to do with Google's management: an accounting rule and the value of the dollar.
The new accounting rule requires companies to report the change in value of shares owned of private companies, something that until now only be relevant when taking profit by selling those shares. For example, Google bought Uber stock, valued by the privately held company at $4 billion.
However, that valuation multiplied by 12 when Uber sold new shares to SoftBank Group (OTC:SFTBY) in January, at $48 billion. According to the new accounting rule, Google was forced to report a 1,200 percent profit on those shares, even though the tech giant didn't sell those shares and therefore did not in fact incur a profit. This added a value of 2.4 billion after tax, or $3.40 per share. Without this added valuation, Google's net profit would have been only $7 billion, in fact missing estimates.
Additionally, the rising dollar added 3 percent in value, turning what would have otherwise been a $30.07 billion disappointing consensus, into a $31.14 estimate beat.
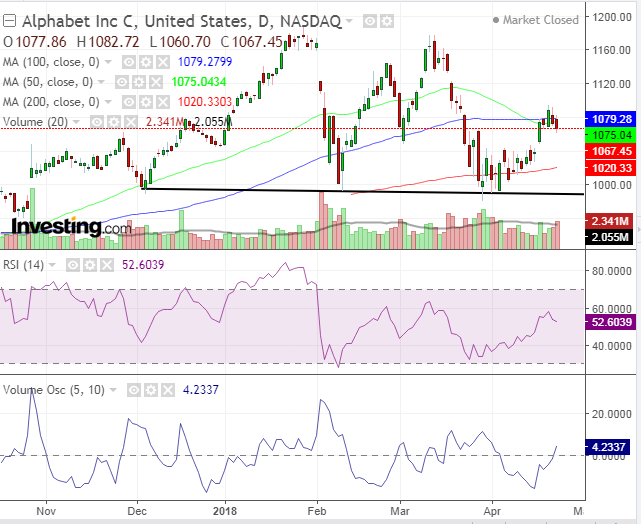
While yesterday's share price decline was small, the downside daily volume was the highest since the early April bottom, after the stock dropped 16 percent from the $1,175 high to the depressing $990-area low.
Google has been facing mounting data privacy regulatory pressure following the Facebook (NASDAQ:FB) Cambridge Analytica scandal, which helped bring down the broader market.
That decline formed a second top, from which the price appeared to recover. However, the price failed to remain above this area, and found resistance at the 50 and 100 DMAs. Also, the 50 just crossed below the 100 DMA, further demonstrating overall falling prices. The Volume Oscillator, which measures the difference between a fast and slow moving average (a broad volume, that of different periods) is rising. This provides strength to the current price movement, which is falling.
Note that the Volume Oscillator possesses a negative correlation with the RSI, which measures momentum. The rally from early April, off $990 is petering out. Note, also, that while the March price peak reached the late January highs, the RSI provided a negative divergence by peaking out at a level that was a lot lower. This loss of momentum may be a heads-up for further price declines.
The neckline at the $990 level is the red line. A downside breakout would suggest a top has been formed and that prices would continue to fall.
Trading Strategies - Short Position Setup
Conservative traders would wait for a decisive downside breakout with at least a 3 percent penetration and either multiple intra-week closes and/or a weekend close, to avoid a bear-trap.
Moderate traders would wait for at least a 2 percent penetration on close before committing to a bearish position.
Aggressive traders may short now, providing they accept the risk of loss.
Stop-Losses (above provided parameters):
1. $1,094.16, the rally high on Thursday.
2. $1,100, a round psychological number.
Targets:
1. $1,040, early April congestion support.
2. $1,020, 200 dma (red).
3. $1,000, round psychological support.
4. $990, neckline support.
5. $900, June-September support.
6. $810, implied target by pattern, measuring its height, per the assumption that the same supply dynamic would repeat itself on the downside.
There are many trading strategies available for the same instrument in the same time. A trader must establish a plan which includes his resources and temperament. This is crucial and determines success or failure.
Pair entries and exits should provide a minimum 1:3 risk-reward ratio. They should suit your time frame, with the understanding that the further the prices, the longer it will take to achieve them. Finally, understand that these guidelines are probability-based, which means by definition they include losses on individual trades, with the aim of profits on overall trades.

