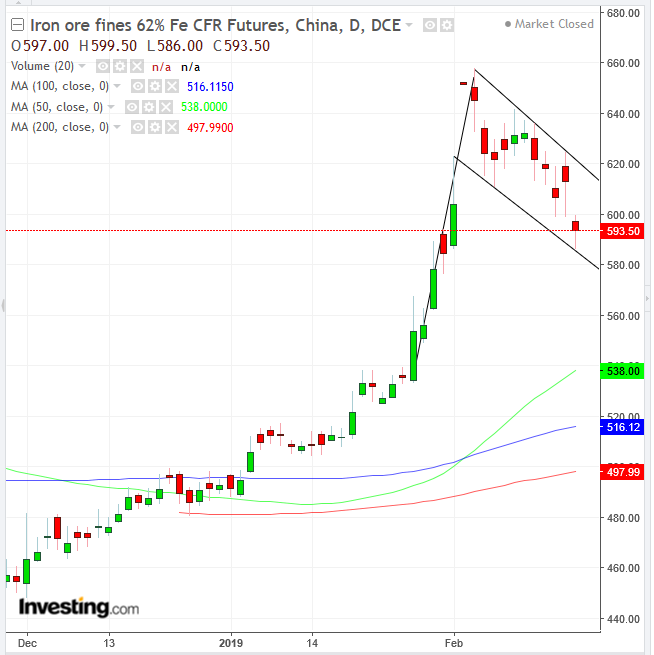
The price of Iron ore has dropped almost 11% in the last two weeks. For the second day in a row—and for the fourth day of five—the base metal gapped down, selling off on news of slowing activity in Chinese steel mills, both because of contracting demand, but perhaps also on ongoing uncertainty surrounding the U.S.-Sino trade war, keeping regional steel makers conservative in their forecasts.
To be fair, tighter environmental regulations in Tangshan, a Chinese city famous for its heavy industry, that's responsible for 11% of China’s steel production, could also be affecting demand. As well, according to the Worldsteel Association, global steel production was 146.7 million tonnes in January, for just 1.0% YoY growth, the weakest expansion in years.
However, technicals could be painting a different picture.

Though the price of the commodity has been falling, it has been trading tightly, in a congestion. This demonstrates there's a tug-of-war at play for contracts, signifying sufficient demand to absorb the supply at these levels.
This pattern is a falling flag, which—contrary to the name’s implication—is bullish. The reason? It refers back to the premise that there is enough to demand to absorb all the supply within the body of the flag. Traders would then be forced to raise their bids above the flag’s boundaries in search of fresh supply, causing an upside breakout, triggering an upward technical chain reaction.
We should stress, the pattern is complete only when it breaks topside of the configuration, setting in motion the dynamics that would propel prices higher, including a short squeeze, triggered by longs and speculation.
The sharp move ahead of the flag’s body is called a flag pole. It shows how prices rose almost vertically. That sets the stage for take-profits as well as new bulls to come in and push prices yet higher. When prices escalate, the early bulls, whose trades formed the flag pole, are enticed back in for another hoped-for rally.
At the same time, today’s trading rose well off the lows, forming a hammer, on the very bottom of the flag.
Trade Strategies
Conservative traders would wait for a decisive upside penetration, employing a minimum 3-percent filter to avoid a bull trap, which would also overcome the presumed resistance of the February lows. Then they’d wait for the likely return move, as the price retests the support of the pattern and the integrity of the trend.
Moderate traders may be content with a 2-percent penetration, to escape the frightening bull trap. They might also wait for a return move, to provide an entry closer to support but not necessarily for proof of support, and the continuation of the uptrend.
Aggressive traders may risk a long position now, after the price tested the bottom successfully, for now.
Trade Sample
- Entry: $593
- Stop-Loss: $586, the day’s low
- Risk: $7
- Target): $614
- Reward: $21
- Risk-Reward Ratio: 1:3
