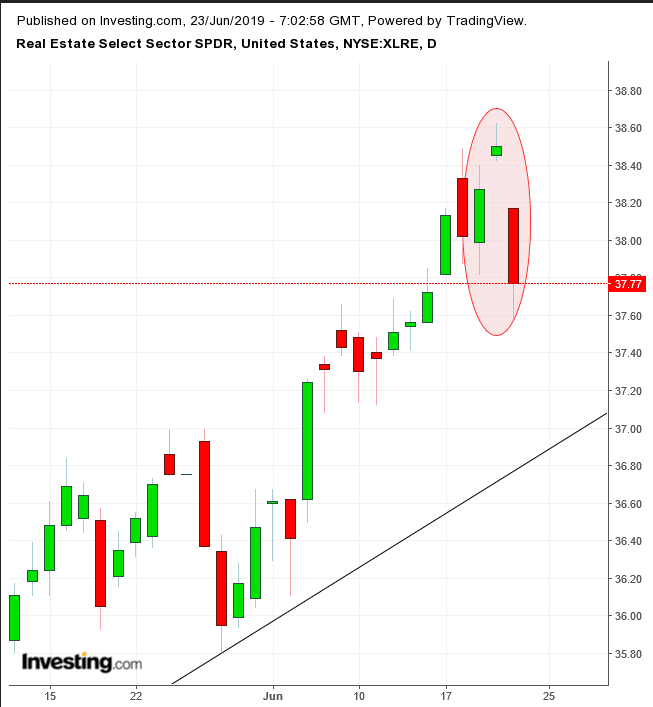
Real Estate (NYSE:XLRE) was the worst performing sector Friday, falling 1.1%, more than double the runner up, Industrials (NYSE:XLI) (-0.5%).
What’s odd about the sector’s underperformance is that recent data and monetary policy should be boosting the subindex to superior performance. Friday’s Existing Home Sales smashed expectations of 1.2% with a 2.5% gain.
Also, the path to lower rates should have spurred the sector, since cuts will mean easier mortgage terms. Finally, yields falling to the 2.00 percent levels, near the lowest since 2017, removes competition from investors who seek passive income.
So, why should investors care?
Because it doesn’t make sense. And when something doesn't make sense, it's time to be extra careful. Is smart money selling off the sector, in much the same way they've been buying Treasurys since November, because they expect a recession? Let’s see what the chart reveals.

The initial boost from the Fed’s dovishness pushed the sector to an all-time-high, but it didn't last long. And it ended in negative territory.
In Western technical analysis, price action separated by gaps is called an island reversal, which occurs after sellers drown out existing demand and lower bids to find more willing buyers. In Japanese candlesticks, the three day move formed an Evening Star.
This one was exceptionally bearish, with the third and final candle not only digging into most of Wednesday’s first candle but virtually erasing all of last week’s gains.
The Taller They Are, the Harder They Fall
A reversal signal is predicated upon its preceding rally, in which the greater the reversal of demand, the greater the potential fall. Since the previous advance posted a record high, there is a greater potential for a reversal.
Trading Strategies
Conservative traders should wait for a potential long position consolidating above the uptrend tend, currently below $37.
Moderate traders may ponder a short position if the price successfully retests the Evening Star’s resistance, with at least one, long red candle engulfing a green or small candle of either color.
Aggressive traders may short at will, after constructing a trading plan that fits their accounts.
Trade Sample
- Entry: $38.50
- Stop-Loss: $38.65, above all-time high
- Risk: $0.15
- Target: $37.00
- Reward: $1.50
- Risk-Reward Ratio: 1:10
