by Pinchas Cohen
As United Parcel Service (NYSE:UPS) gets ready to report its latest earnings tomorrow before the market open, experts are weighing in with their best predictions. FactSet's median EPS expectation is for $1.45, while Estimize expects $1.49, versus $1.44 YoY, with a revenue of $15.62 billion according to FactSet and $15.75 for Estimize, versus $14.93 billion YoY.
3 Questions Weigh On UPS
The first question that on investors minds is whether UPS management is lowballing guidance to avoid disappointing markets and investors. UPS Chief Financial Operator Richard Peretz said last quarter that “earnings per share should be relatively flat when compared with last year.”
He also claimed a stronger dollar and higher fuel prices would offset third quarter profits. Finally, he posited that a shorter quarter, by one day, should hurt profits too. This long list of preemptive reasons for poor earnings reads like an attempt to lower expectations and avoid upcoming disappointment.
Secondly, the recent acquisition of Whole Foods begs the question: what impact will this have on UPS? While the Whole Foods acquisition is expected to contribute to the bottom line next year, it’s unclear what the impact will be for the remainder of this year. Piper Jaffray expects a $1.4 billion contribution for the month of September.
Finally, investors worry whether UPS will be able to handle this year's holiday peak. UPS, as well as FedEx (NYSE:FDX), underestimated holiday volumes in 2013, for which they overcompensated in 2014. Both being understaffed initially, then being overstaffed the following year hurt profits.
Will UPS get it right this year?
The Technicals

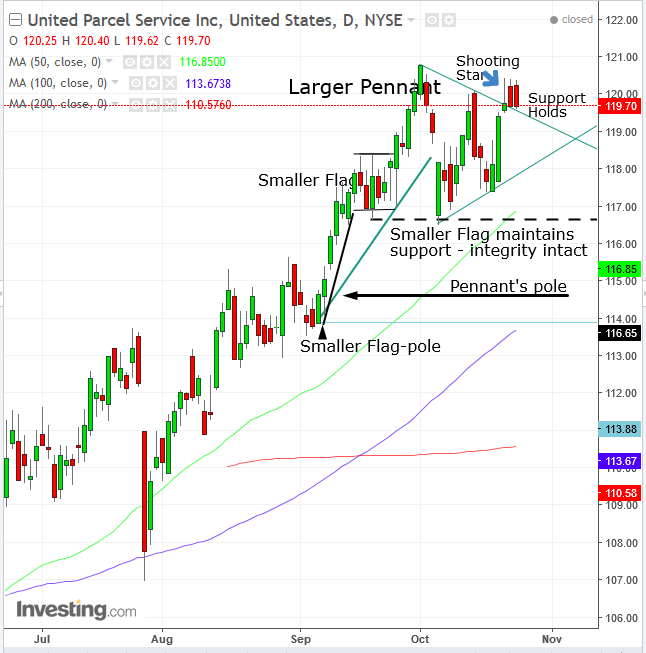
The price has traded within a continuing flag formation. First, it formed the flag-pole, between September 7 at $114, and September 18 at the high price of 118.36. The breakout on September 26 achieved about half of the flag’s implicated target and fell back below the flag’s top, rendering it a failure. However, the flag’s bottom maintained support at that level. As if to compensate, a second, larger continuing Pennant pattern developed, with the same continuation-psychology as the flag, only the pattern is much bigger with an equally bigger target.
On Friday, the price penetrated the top of the pennant, but failed to hold on to gains, forming a bearish shooting-star. In the following two sessions, the price failed to penetrate the shooting-star’s resistance, but also managed to stay completely above the pattern, suggesting this may have been the return-move.
Recently, there has been an unusually high volume of large blocks of call options, as far as into 2020. This looks like the footprints of large institutions, suggesting smart-money demand is rising.
There is also one more thing to consider.

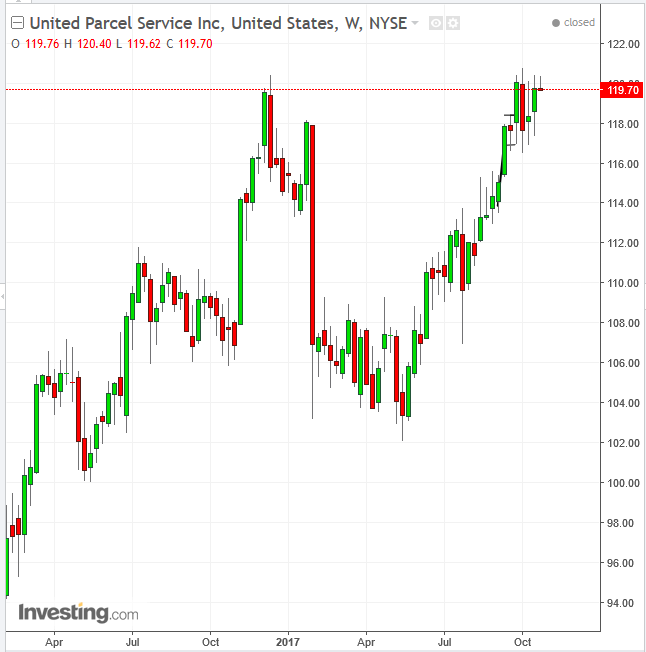
The price stopped at the December 2016 high. This could prove a catalyst for a significant jump or a reversal, depending on whether buyers overcome everyone who remembers the 15 percent fall that followed that price within the next 7 months and thinks the move may repeat itself.
Trading Strategies
Conservative traders would wait for further evidence of the uptrend’s integrity with a peak higher than the October 2, $120.80 high, then wait for a dip.
Moderate traders may wait for a close above the shooting-star’s $120.43 resistance, before joining in a long position.
Aggressive traders may go long now, with a stop-loss beneath the $119 level.
Very aggressive traders may enter a contrarian short position, with a stop-loss above the shooting star, upon a potential additional round within the pennant before a real breakout, before joining in a long position. They also may enter a long position upon the failure of this short position.
