by Pinchas Cohen
According to a recent report by the International Monetary Fund (IMF), Brexit uncertainty is a weight on economic growth in the UK. Additionally, they have said:
“If the United Kingdom leaves the European Union without an agreement, there will be a notable increase in trade barriers, potentially accompanied by disruption of services in various sectors, with significant negative impact on economic activity.”
Previously released forecasts from the IMF predict UK gross domestic product to expand by 1.7% this year, slowing to 1.5% in 2018.
Rising Oil, Political Turmoil Weigh On Pound
If that’s not enough, Samuel Tombs, Pantheon’s chief UK economist says, “the recent surge in oil price has added to the headwinds set to batter the economy over the next year.” This was published last Wednesday. Since the UK uses more foreign oil than it can produce itself, it needs to import the difference. After last month’s inflation hit its highest level in 5 years (while real wage growth has waned, and economic growth slowed down significantly) the rising price of oil is going to reduce the pound's purchasing power even more.
Finally, the recent string of political scandals in Prime Minister Theresa May’s administration have reached a level that can easily compete with that of the White House. Forty members of her own party are prepared to oust her. The political uncertainty is more than just disruptive; it renders the UK government dysfunctional at a time when it needs to unite against its economic opponent, the EU.
Multiple Bearish Signals

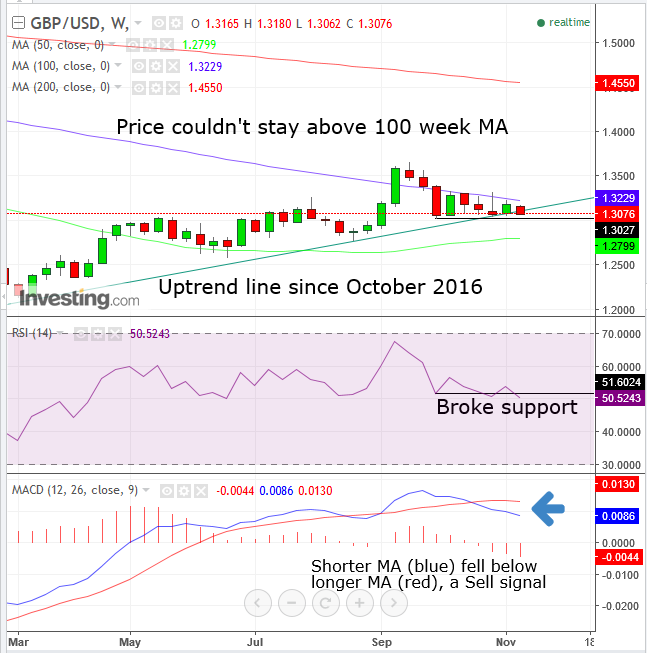
The pound has declined on an intraday basis below its uptrend line since the October flash crash of 2016. While a bearish signal is given when the price closes below the uptrend line, multiple sell signals were provided on the weekly chart.
- After crossing the 100-weekly moving average (blue) for the first time since September 2013, the price could not hold onto its gains and preceded to fall back beneath it, where it’s been suppressed for the last five weeks.
- The MACD provided a sell signal on the week ending October 23, when the shorter moving average crossed below the longer moving average, demonstrating that the recent price set is declining compared to an older price set.
- The RSI provided a sell signal on the week ending October 30, when the momentum slowed down, with the RSI crossing below the momentum of the October 2 through support. Since momentum generally leads price, it is therefore expected that the price will catch up and cross below the October 2, 1.3027 price, as well.
Trading Strategies
Conservative traders do not trade against the trend, and the current trend is still up. A formal reversal will take place after two peaks and troughs would register in a downward direction.
Moderate traders would at the very least wait on a short for close beneath the October, 1.3027 low, as well as a filter to avoid a bear-trap.
Aggressive traders may short now, with a stop-loss their account can afford that isn’t more than a third of their target, providing a 1:3 risk-reward ratio. The range-top is 1.3321. A close above that level would suggest a resumption of the uptrend. A downside breakout would set the first target at the August, 1.2772 low.
