by Pinchas Cohen
Making Sense Of Australia's Murky Economy
According to economics professor Richard Holden at UNSW in Sydney, Australia is heading into 2018 with mixed economic signals. While the US economy appears to be growing, with tightening monetary policy continuing throughout next year, Australia’s economic outlook is murky, with a number of points painting a confusing picture:
- Australia’s market narrative is that its housing boom is over, after the ABS residential house price index for September fell 0.2%. However, according to Holden, this is only an expected correction within a whopping 9.4% 12-month uptrend. So is housing data positive, or negative? Depends who you ask.
- The Westpac consumer sentiment index came in stronger than expected, rising 3.6% in December to 103.3 points. Westpac’s chief economist Bill Evans said, “This is a surprisingly strong result and confirms the lift we have seen in the index over the last three months.” This is positive data, through and through.
- The NAB Monthly Business Survey dropped 9 points. Is this negative? It’s still +12, more than double the +5 average. Moreover, some of the business concerns were on the rising wages that workers must now be paid. As has been discussed at length here, rising wages are necessary to spur inflation for the economic growth of developed economies. In other words, what may appear to be bad data is actually good data that's veiled.
- Unemployment remains high at 5.4%, which is decidedly negative data.
As investors try to get a clearer picture of where the Australian economy is headed in 2018, they will primarily follow developments in the housing market along with the holiday season retail figures.
Supply And Demand Struggling

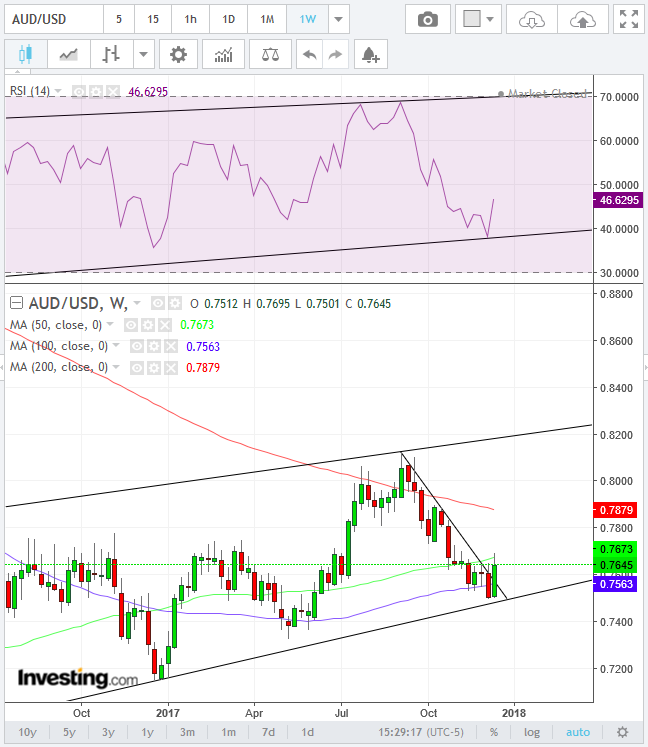
The AUD/USD pair dropped 7.60 percent in 3 months, between the week of September 4 and the week of December 4, the worst fall since the 8.10 percent drop in the seven weeks between the week of March 20 and the week of May 8.
The pair found support at the bottom of its rising channel since the week of January 11, 2016. That support is confirmed when the price crossed above the channel, signaling an end to its downtrend line since the week ending September 4.
Momentum Precedes Movement
The price chart is confirmed by the RSI chart. As a leading indicator it began its uptrend line (bottom of its rising channel) nearly a full year earlier, on the week ending January 26, 2015. The RSI, like the price, found support at the bottom of its rising channel.
Moving Averages – Statistical Trend Lines
The 50 (green) and 100 (blue) week MAs align with the channel-bottom, while the 200 (red) week MA represents the resistance of the channel-top. As price will rise, it will likely push the 200 toward the former, September peak, at 0.0825.

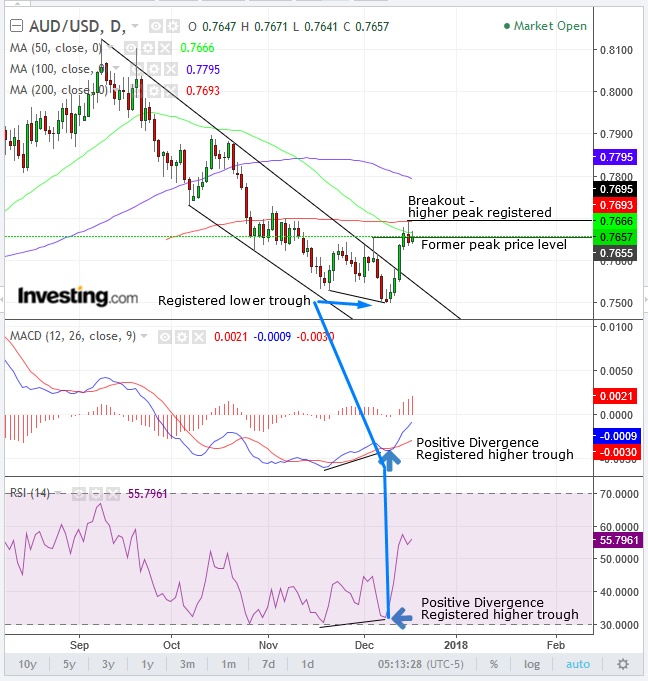
In this chart, we “zoom in” to the price crossing over the downtrend line since September 8, which we’ve seen on the weekly chart. Now, we can see it is in fact a falling channel.
While the price crossed over the downtrend line and has raised questions regarding the downtrend of the period, it has yet to complete a trend reversal.
A trend is constituted by a series of a minimum of two peaks and troughs in the same direction. A trend reversal is called when two new peaks and troughs registered in the opposite direction. While a new, higher peak than the former, 0.7655 peak posted on December 5 was registered in the last two days of trading, making two peaks in an upward direction, two rising troughs have yet to be registered. Therefore, the peak-trough series is still descending.
Finally, the fact that the price ended the week closing right on the support-turned resistance since October 27, visually demonstrates the struggle between supply and demand.
Mixed Technical Indicators
Positive Signals
Both the moving-average interplay MACD and the momentum RSI provided buy signals. The MACD’s shorter MA (blue) crossed over the long MA (red), demonstrating that recent prices are rising over older ones, potentially because of shifting trends. The RSI provided a buy signal when it provided an upside breakout of its range, ahead of the price, in both instances. Both have also provided positive divergences, when their recent trough registered higher than their preceding troughs, diverging from the price action, where the recent trough posted below its forerunner. This suggests that prices would turn up.
Negative Signals
Moving averages executed two dead crosses when the 50 dma (green) crossed below the 100 dma (blue) and late last week below the 200 dma (red). These demonstrate a potential shift in trends in various parameters. Moreover, the price crossed above but fell back below the 50 and 100 dma’s, with a potential bearish Shooting-Star (with a lower shadow, weakening its significance) demonstrating their resistance.
Trading Strategies
Conservative traders would wait for a second trough to be registered before entering a long, and they would not enter a short, as the current downtrend is in question.
Moderate traders may enter a long after a return-move to the violated downtrend line, probably at the 0.7550 level.
Aggressive traders may enter a short position, counting on the return-move signaled by the bearish moving-average formation, potential Shooting-Star and support-resistance line since October 27. They could wait for the pair to edge higher in retesting the resistance to secure a better entry, avoiding whipsaw. After the return-move, they may go long with the rest of the market.
Equity Management
Stop-loss: above 0.7700, Friday’s peak and 200 dma is likely to provide resistance by bears, who’d like to repeat Friday’s decline.
Targets:
- 0.7560, Nov. 29 – December 1 support
- 0.7530, Nov. 21 support
Risk-Reward Ratio: Minimum 1:3
A stop-loss and target must be selected together, to ensure a higher potential reward than risk the trader assumes, in order to retain statistical superiority in his overall trading.
Example 1: far stop-loss, close target
- Entry: 0.7645
- Stop-loss: 0.7711 – risk: 66 pips
- Target: 0.7560 – reward: 85 pips
Risk-Reward Ratio: 1:1.3
Conclusion: bad stop-target combination = unfavorable statistics
Example 2 – closer entry to stop-loss
- Entry: 0.7680
- Stop-loss: 0.7710 – risk: 30 pips
- Target: 0.7560– reward: 120 pips
Risk-Reward Ratio: 1:4
Conclusion: good stop-target combination = favorable statistics
Example 3 – farther target
- Entry: 0.7645
- Stop-loss: 0.7710 – risk: 30 pips
- Target: 0.7525 – reward: 120 pips
Risk-Reward Ratio: 1:4
Conclusion: good stop-target combination = favorable statistics
