Australian business investment weakened in the fourth quarter by 0.2 percent QoQ, missing a 1 percent forecast.

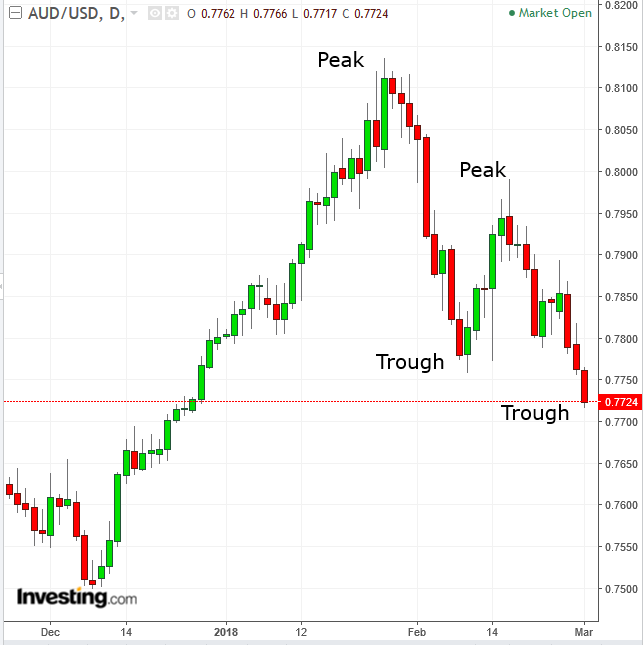
The Aussie has fallen more than half a percent today, forming a second trough, lower than the one posted on February 9, completing two peaks and troughs in a falling pattern, forming a downtrend.
The price crossed below the 50 dma (green) on February 21. It retested the current price’s weakness relative to the average of the last 50 trading days on February 26. The 50 dma proved a resistance, reaffirming the current price’s weakness. Yesterday, the current price crossed below both the 200 dma (red), followed by the 100 dma (blue), showing the price weakness to be greater than the average price of those periods. Also, the 100 dma crossing below the 200 dma reveals that the shorter period is weaker than the longer period.
The RSI and MACD provided sell signals. This happened when the RSI also completed the descending peak-trough formation, when it fell below its former trough one day earlier, on February 8. The MACD’s shorter moving average fell below the longer one, demonstrating that more recent prices are falling more significantly than earlier prices, just like the price MA’s did.

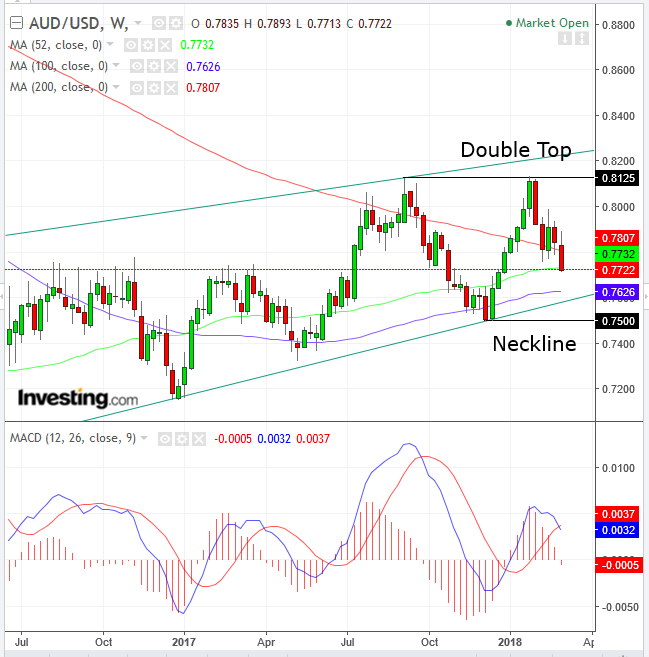
On the other hand, in the weekly view, the pair is still within an uptrend, trading within a rising channel since January. The current decline may be considered nothing more than a correction within the long-term uptrend.
However, the price did fall below both the 50-week MA (green) and 200-week MA (red), and the MAC provided a sell signal, when the shorter MA fell below the longer one, all signaling a potential end to the long-term uptrend.
Trading Strategies – Short Position
Conservative traders would wait for the long-term trend and the medium-term trend to convene, with the long term entering a bearish formation as well. That may happen after the price falls below the 0.7500 level that marks the neckline of a double-top, which will have also included falling out of its rising channel.
Moderate traders may wait for the price to retest the new trend. It would do so when it would rebound but be overwhelmed by supply, which should have increased if indeed the tides had turned. A red candle engulfing a green candle may be the signal.
Aggressive traders may short now providing they can hold on through a potential backlash, as described in the previous paragraph. Alternatively, they may enter with a stop-loss appropriate to their equity management.
Equity Management
Stop-Losses (Above levels provided):
- 0.7785, 200 dma
- 0.7890, 50 dma & downtrend-line
Targets:
- 0.7625, next support-resistance level
- 0.7500, December low (previous long-term trough)
- 0.7330, May 2007 trough
- 0.7150, December 2016 trough
- 0.6975, implied double-top target, should it complete, and August 2015-January 2016 bottom
There are many trading strategies available for the same instrument in the same time. A trader must establish a plan, which would include his resources and temperament. This is crucial and determines success or failure.
Pair entries and exits should provide a minimum 1:3 risk-reward ratio. They should suit your time frame, with the understanding that the further the prices, the longer it will take to achieve them. Finally, understand that these guidelines are probability-based, which means by definition they include losses on individual trades, with the aim of profits on overall trades.
