The strongest gusts in today’s market headwinds are coming from U.S. President Donald Trump’s plan to hit Mexico with tariffs, after he said that country's efforts to mitigate the flow of undocumented migrants and illegal drugs were “not nearly enough.”
Markets eased on reports yesterday that the Republican mutiny against the Commander in Chief would block Trump’s trade war, after Democratic Senator Chuck Schumer insisted it was just a bluff from the get-go. Meanwhile, Republican and Senate Homeland Security Committee Chairman Ron Johnson said Congress doesn’t have the votes to block Trump and the tariffs will take place as planned.
While events play out, USD/MXN is offering traders a chance to profit from the chaos. Indeed, the technical chart provides suggestions for how to take advantage.

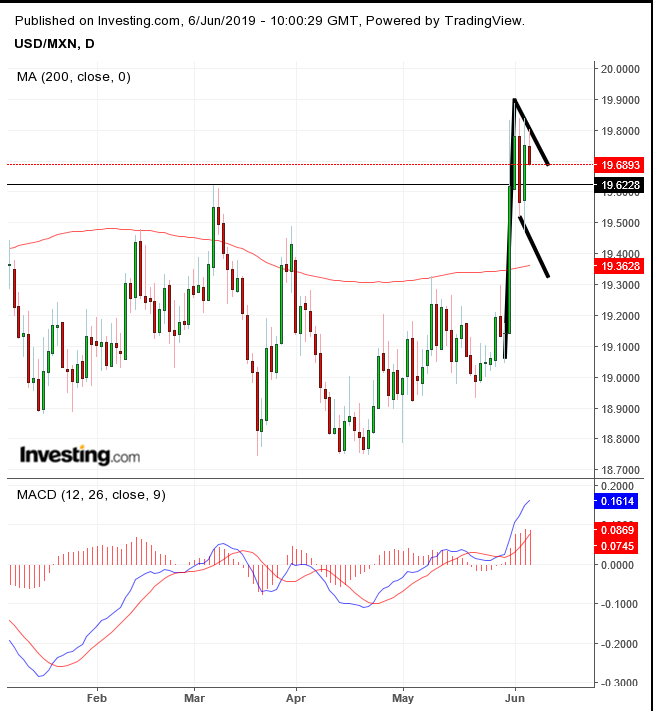
After as much as a 4% jump in in two days on Trump’s new tariffs against Mexico, peso prices have been consolidating for the last three days as traders wait to see what will actually happen. So far, the dollar has completed a double bottom—marked by the 200 DMA—against the peso, with a 1.4% penetration, satisfying an aggressive risk aversion to filter out a bull trap.
Since then, the sinking consolidation has been trading according to a falling flag, which is bullish in an upturn. The fact that prices remain above the neckline reinforces expectations for a continued rally for the currency pair. A topside breakout will complete the small continuation pattern, adding to the large reversal formation.
At the same time, the MACD’s short MA jumped higher than the 200 DMA, after they both crossed the zero line, demonstrating a rebound across multiple price gauges. So far, aggressive traders have already had the satisfactory upside breakout of the double bottom, and everyone else is waiting for the flag’s completion.
Trading Strategies
Conservative traders will wait for an upside breakout of the flag, with a penetration past the 20.2100 price level, both for the psychological implications of traversing the round number and for a fuller penetration of the double-bottom neckline. Then, they’d likely wait for a return move to retest the support of the patterns, manifested with at least one long, green candle engulfing a red or small candle of either color.
Moderate traders would also wait for an upside breakout of the flag, past the 20.0152 price level, for negotiating over the 20 key level and to satisfy a 2% filter from the double bottom’s neckline. While they, like conservative traders, might wait for a pullback for a better entry, they won’t necessarily wait for stronger proof of a reversal.
Aggressive traders may buy in now, betting that Trump is on a war path to start a clean slate with a new order to global trade, before he asks his support base to come out to vote again in 2020. He might also want to get a bear market out of the way, so that he comes to elections supported by a rejuvenated, young bull market.
Trade Sample
- Entry: 19.7000
- Stop-Loss: 19.6000
- Risk: 1,000 pips
- Target: 20.0000, key price level
- Reward: 3,000 pips
- Risk-Reward Ratio: 1:3
