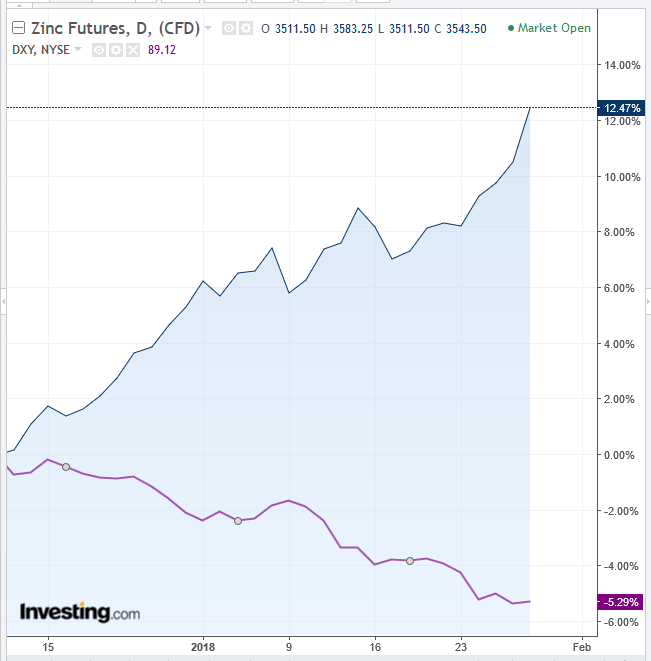
Everything is coming together to propel zinc to a decade high price. Inventories slipped Friday to their lowest levels since 2008, indicating supply is tight. At the same time, demand is on the rise because of synchronized global growth which is expected to continue due to an improving economic outlook.

Perhaps the biggest boost for the base metal however, has come from the weakening US dollar, which makes commodities priced in dollars proportionately cheaper.
Correction on the Way?
But before traders jump in for a quick buck, consider that after an unheard of 16-day straight rally, a correction is very likely.

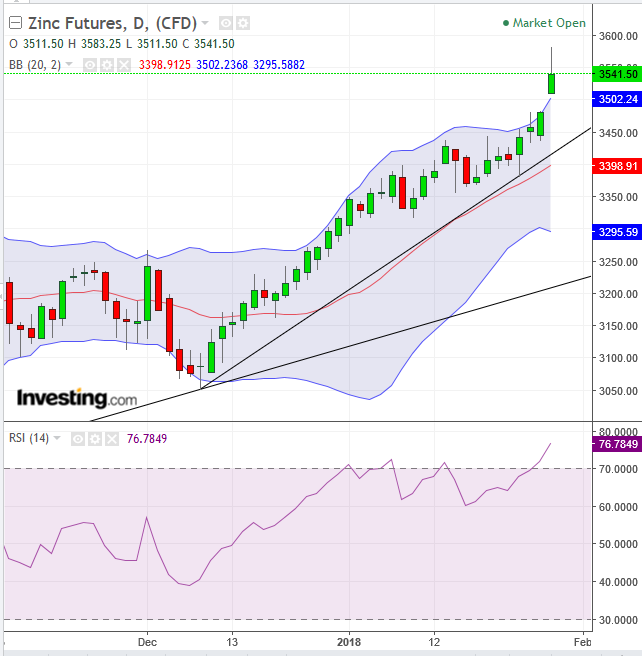
Since the open, today’s candle has retreated by more than half of its extended gain (on top of the gap), demonstrating there are still bears who are pushing back. Any further push lower and a shooting star would be formed.
Today’s trading thrust the price clear above the Bollinger® Band upper bound. We looked back all the way to mid-2013 and could find no precedent for such a move.
Bollinger bands provide an estimated mean range for price movement. Note that the center line (red) has aligned with the uptrend line since December 8. It attests to the uptrend line's validity.
Trading outside the range demonstrates unusually high volatility. However, interpretations vary on how to handle this from waiting for a return to the mean to go long again, to shorting a presumed return to a mean before even going long on the hope of a fat tail, when an event exceeds the mean. John Bollinger encouraged using his bands together with various indicators for a “difference of opinion,” in order to arrive at a fuller picture.
The RSI – measuring momentum of the price changes – has reached the most overbought level since mid-August. A picture thus emerges in which zinc is extremely overbought. While overbought conditions do not necessitate an immediate correction, they increase its probability.
Trading Strategies
Conservative traders are likely to wait on a long entry for the overbought indicators to return to an oversold condition, as a deep correction provides a buying dip. A good entry might be when the price returns to its uptrend line since June 7, 2017, currently at 3,250, where the August-December range occurs.
Moderate traders are likely to wait before entering a long position for a long entry with a return to the uptrend line since December 8, “guarded” by the Bollinger Band center line.
Aggressive traders may risk a short, counting on the unusual and extreme overbought condition. They might wait for a retest of the day’s high, for a better entry, but if a correction takes place, that might not happen. Their target should be based on the parameters set above.
