Twitter (NYSE:TWTR) shares were sold off last week, after a Congressional hearing on Thursday during which lawmakers grilled the CEOs of major social media platforms regarding the availability of misinformation on Twitter, Facebook (NASDAQ:FB) and Google (NASDAQ:GOOGL). The dip, however, was only temporary.
The social media stock has already rebounded, nowithstanding its founder and CEO Jack Dorsey being called out for trolling the legislative body during the hearing. This wasn't the first time Twitter has come under fire. The platform was heavily scrutinzed during the highly contested US presidential election and garnered additional focus as the drama surrounding the banning from the site of then-President Donald Trump unfolded.
Yet, the company still posted positive Q4 earnings results, demonstrating resilience, even amid the perhaps temporary exodus from the site of Trump supporters protesting the ban. As well, the stock's recent rut was consistent with the broader tech sector selloff.
Adding to reasons for investor optimism on the San Francisco-based company: Twitter has significantly improved its platform architecture, in order to boost its ability to be a source of better potential income for advertisers by more efficiently targeting users, something that doesn't yet appear to have been priced in by markets after the platform was reengineered.
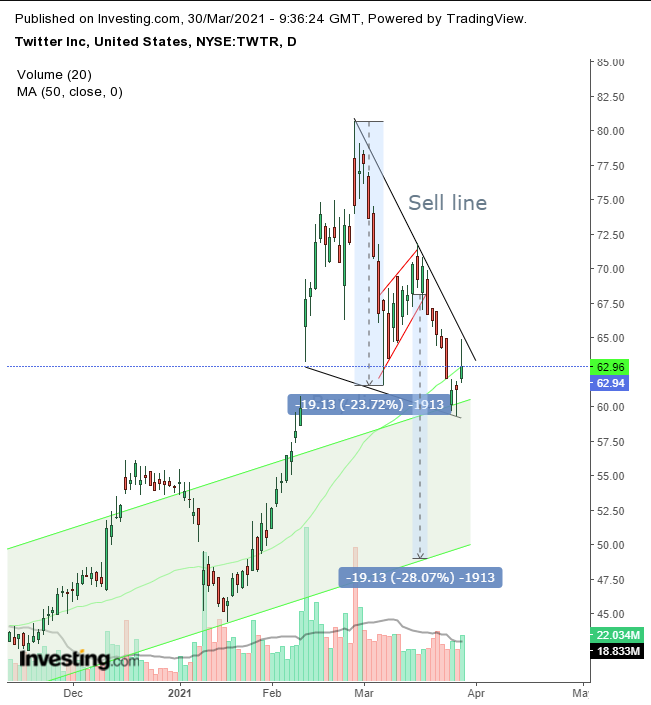
As if the fundamentals weren't reason enough to be bullish on the stock, we also see an opportunity from a technical perspective. The chart is signaling that the 27% correction from its all-time high of $80.65, posted on Feb. 24, is over, providing a buying dip at this stage.

The stock has been trading within a falling wedge formation since it gapped up 10%, closing higher by more than 13% after its Q4 earnings release in early February.
The selloff that followed from its late February record was part of the larger selloff of the bigger tech sector. The fact that the demand line didn’t match the steepness of the sell line suggests a market disagreement and therefore an opportunity.
A falling wedge tends to occur after a climactic rally, as described above. Notice that the post-earnings rally broke free of the stock’s rising channel. Notice, also, that the channel currently provides a support to the wedge, suggesting it’s the new floor.
Wedges invariably break against their prevailing direction, in this case to the upside, but it is important to wait for the actual breakout. While there's a 2% probability of failure in declining wedges, traders will be whipsawed out if they don’t have sufficient margin for wide stop-losses if the pattern has not yet completed. As a rule, ths is one of the most profitable patterns.
But bear in mind, caution is in order. Part of the wedge was a rising flag, which may prove bearish after the preceding near-24% plunge, targeting a repeat downside move in the dollar amount, which just so happens to reach the bottom of the rising wedge. However, given that the long-term trend is up as signaled by the other fundamental and technical factors already described, an upside breakout may cause a flag failure, something far more common than wedge failures.
Trading Strategies – Long Position Setup
Conservative traders should wait for the upside breakout, with a penetration above the Mar. 16, $71.80 high, then wait for a buying dip.
Moderate traders would wait for a close above $65.
Aggressive traders could enter at will, given they understand the heightened risk that corresponds to the heightened reward which goes with being one step ahead of the rest of the market. Therefore, a trade plan is crucial, to ascertain the viability of a sensible trade.
Here’s an example:
Trade Sample
- Entry: $60
- Stop-Loss: $59
- Risk: $1
- Target: $80
- Reward: $20
- Risk:Reward Ratio: 1:20
Author's Note: This is just a sample. There are many different approaches to the same trade, based on your timing, budget and temperament. For example, one could enter at $62, in case the price doesn’t dip to $60, thereby missing the trade, for the price of paying $2 for the earlier, more certain entry. A trader can exit at $70, to capture more certain, but lower profits. Until you find what you’re comfortable with and works best for you, take small trades, to learn and gain experience, not to profit. Otherwise you’ll gain neither experience nor profit. Happy trading!
