Volatility is back. The VIX, often referred to as the “fear gauge,” has been on the rise since the market's November low, providing a negative divergence to stock prices which just keep vaulting to new records.
But a new, mysterious variant of the coronavirus in the UK—just as vaccines are finally rolling out worldwide—is making everyone nervous. This could be the fundamental motivation for investors to finally rush back into gold. That and the dollar’s downward trajectory over the longer term.
We should say upfront, we've been wrong before about the precious metal. After it hit its current all-time high of $2,074.88 in August, breaking its own record for the first time since 2011 (something we did forecast), the yellow metal didn't do what we thought it would.
While we were spot-on regarding the dollar’s downturn, we thought gold would continue higher, rising both because of its dollar-denomination as the USD weakened as well as because of the non-existent yields coming from the greenback as it slipped, which should have made gold more attractive to investors—or so we thought.
Now we think a gold breakout is in the cards again, though we can't know for sure, of course. Currently, it’s still within a medium-term downtrend since the August peak. However, we are seeing signs of a reversal.
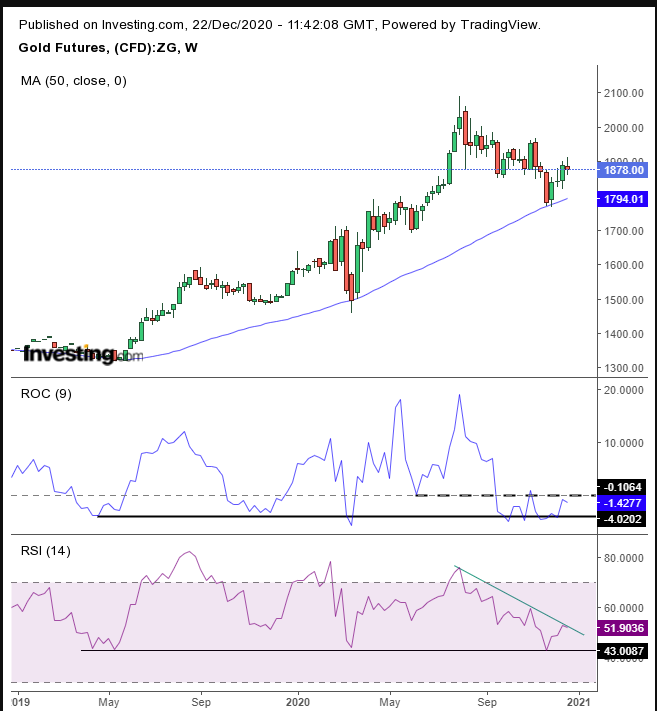
We'll start by noting the bigger picture, as it looks on the commodity's longer-term, weekly chart.

Gold found support by the 50-week MA, underscoring that the long-term trend is still up, despite the drop since the August all-time high. Also, both the weekly RSI and ROC are in position to bottom out.
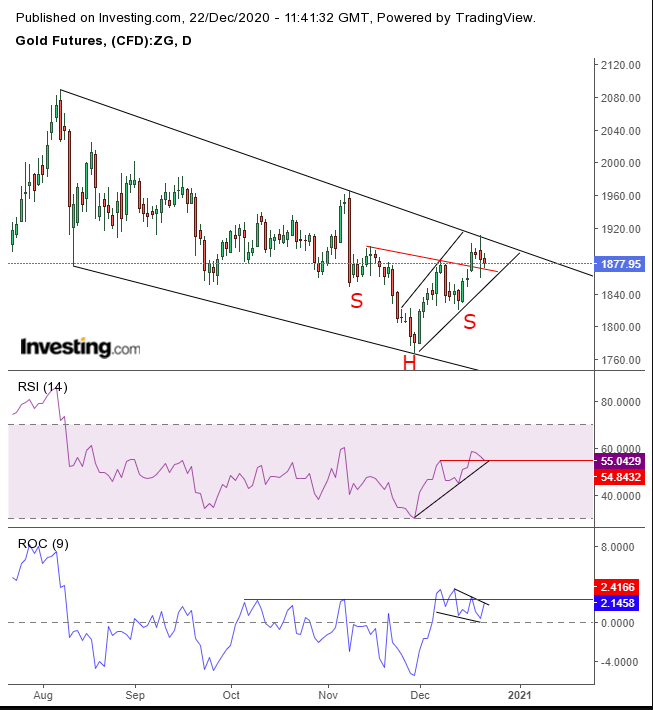
Now, we'll zero in with the daily chart:

While gold swung from sharp gains to losses, on Monday, as well as today, it found support above the neckline of a small H&S bottom. Traditionally, a H&S should last at least 3 months, though this one is just a month long.
On the other hand, markets seem to have accelerated their pace of movement, as we've seen in this year’s fastest bear market on record, only to be immediately followed by the quickest exit from a bear market in history.
Gold's decline over the last three days occurred within a tight range, demonstrating remaining demand, while yesterday’s deep penetration to the neckline, followed by its rejection, reinforces the view that demand is overcoming supply.
The RSI is testing its support—both of its uptrend as well as its previous highs. The ROC is forming a falling flag, but most importantly, it's happening right on gold's highs going back to October. That's typical for bullish flags, as fresh bulls pick up positions vacated by early bulls who are cashing out. That also fits the H&S penetration.
A note of caution though: the price is still trapped within a medium downtrend, well defined by the falling channel. It's been unable to break through the seller’s line since nearing it on Thursday.
That resistance goes hand-in-hand with the dynamics of a potential reversal, serving as a tight coil before it springs. If it springs.
However, if the price falls back below the short-term rising channel since the Nov. 30 low, momentum would rise, to continue along the medium-downtrend, framed within the channel.
Perhaps gold's decoupling period with the dollar is over and the two will now resynchronize. Whatever happens next, a short right now could provide risk-takers with an attractive risk-reward ratio, before the precious metal heads higher.
Trading Strategies
Conservative traders would wait for a decisive decision by the 'collective' trader as to whether the commodity continues along its short-term rising channel or via its medium-term falling course. Traders in this class, who only take the rare, ideal trades, would wait for a minimum 3 day (preferably to include a weekend), 3% filter in either direction, followed by a return-move to retest the trend.
Moderate traders would be content with a 2-day, 2% filter and for a corrective, take-profit move for a better entry, if not for confirmation.
Aggressive traders may enter a contrarian trade, both to the current selloff and to the medium-term downtrend, and go long, provided they understand and accept the risk and keep a tight trading plan.
Trade Sample
- Entry: $1,869
- Stop-Loss: $1,859, yesterday’s slow
- Risk: $10
- Target: $1,969
- Reward: $100
- Risk:Reward Ratio: 1:10
