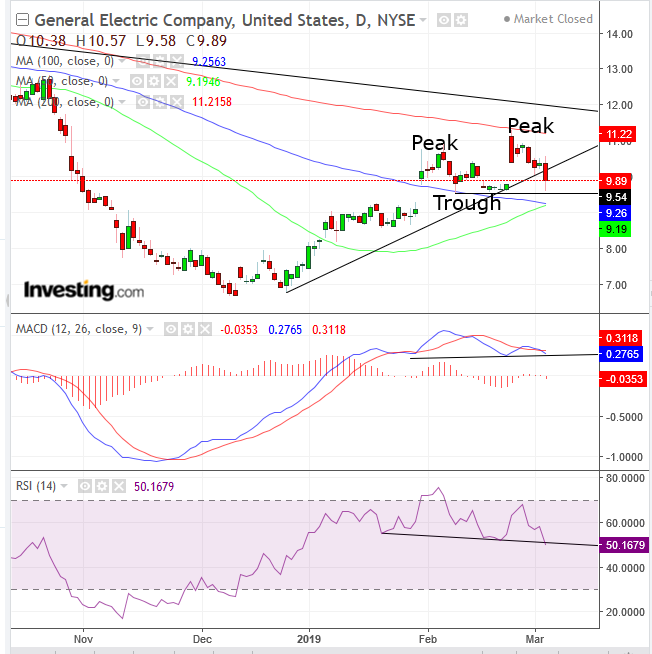
General Electric (NYSE:GE) plunged as much as 7.71% yesterday, closing 4.7% lower at $9.89, in the worst selloff since the November rout and after having gained almost 40% from the beginning of the year. Yesterday's dive means that since this time last year shares have sunk more than 30%, from $14.64 at the March 6, 2018 close.
Traders dumped the stock after CEO Larry Culp warned of negative cash flow, suggesting the once admired, industrial conglomerate will need to raise capital by issuing new equity or debt or by selling asset. Not news shareholders appreciate. Plus, it attracts short sellers.
Last year GE enjoyed a $4.5 billion cash flow. The dismal outlook after last year’s well-oiled cash machine builds on the negative outlook for the overall economy this late in the business cycle, adding to investor worries about the state of the longest bull market on record.
Could this a buying dip? We don’t think so. Here’s why.

GE just fell below it’s short-term uptrend line since the December bottom, increasing the odds the price would join its medium and long-term downtrends. The stock was falling well before yesterday’s negative cashflow outlook. It touched the 200 DMA on Monday, then dropped as if the MA was red hot, then continued slipping early Tuesday before the announcement.
The selloff has since stopped the 50 DMA from crossing above the 100 DMA, demonstrating resistance. Both the MACD and RSI are forming Head & Shoulder tops, demonstrating that both momentum and multiple price data are showing signs of weakness.
Trading Strategies – Short Position Setup
Conservative traders should wait for the short-term trend to establish a series of descending peaks and troughs. As of now, the peaks and troughs are still in a rising formation.
Moderate traders may short after the price closes below the previous trough of $9.54 posted Feb. 8.
Aggressive traders may enter a short position now, provided they can afford a stop-loss to allow for a retest of the medium-term downtrend, as high as $12, or assume the risk of being stopped-out.
Trade Sample
- Entry: $11.00
- Stop-Loss: $12.00
- Risk: $1
- Target: $8, above November-December highs
- Reward: $3
- Risk Reward Ratio: 1:3
