The world's leading e-commerce retailer, Amazon.com (NASDAQ:AMZN), is scheduled to report Q1 earnings on Thursday, Apr. 29 after the close. Expectations are for a whopping $9.49 EPS, almost double this metric YoY, on $104.49 billion in revenue—a 35% jump from the same quarter last year.
Amazon has been benefiting from the pandemic environment that's hammered other retailers, as shoppers in lockdown turned to the tech giant for an array of products they could buy from home. Some might say it's a no-brainer that the Seattle-based company would show significant improvement over recent quarters. But Amazon may just be in a retail class by itself.
As a business, the e-tailer excelled during the stay-at-home environment not just because of its entrenched position as a retail powerhouse, but also because of its expanding versatility into additional areas such as the cloud via Amazon Web Services as well as streaming entertainment and artificial intelligence. Given the shift in its business structure at large, which at its core enables working remotely, Amazon stands to grow its business exponentially via just its cloud segment.
Indeed, the company has a history of not just beating quarterly expectations but blowing them seriously out of the water to boot. Will this pattern endure? Investors seem to think so.

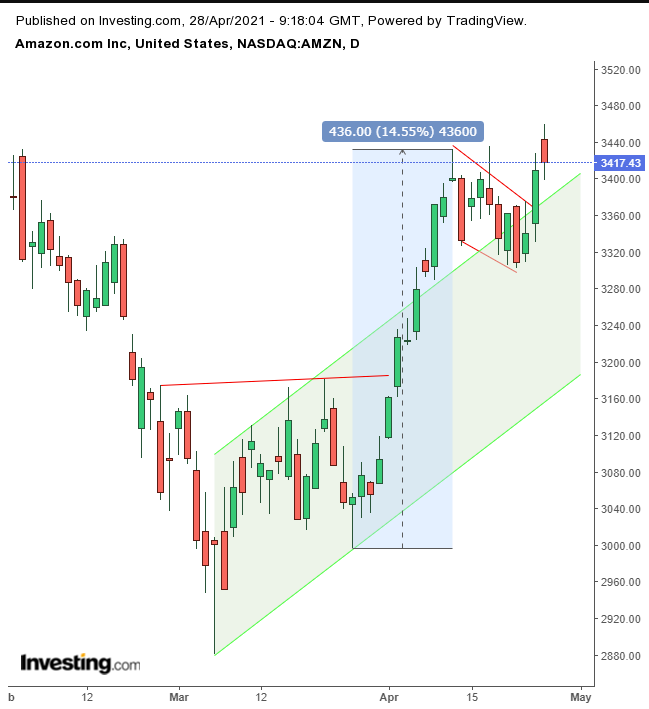
The stock completed a falling flag, bullish after a 10-out-of-12 day advance, during which the price rose 14.5%. That’s more than a full percent per day over a two-week trading period, which occurred after the stock bottomed out.
The flag is a market slingshot. It’s a period during which early bulls—after the steep preceding move—cash out to take a breather and new bulls take over. In order to confirm that the recent congestion contained the dynamics of a falling flag, we're looking for additional clues on the chart.
This type of flag is a pattern that tends to develop midway through a rally and the preceding bottom supports that view. We also note that the flag developed after breaking through the current rising channel, suggesting it had outlived that rate of escalation and is now moving beyond it, using it as floor off which to bounce.
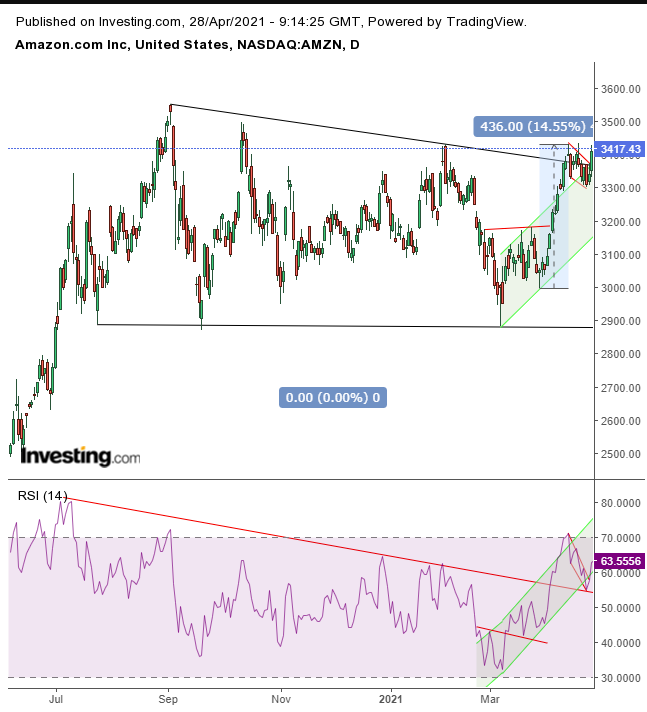
As well, we can see a larger picture emerging if we take a longer view.

The flag, a market mechanism to pick up momentum, was required for the price to break free of a range since September's all-time high. The RSI shows that momentum has been supporting the price bottom, which has been in an uptrend since the March bottom, as well as an upside breakout of the entire range.
Rumors which surfaced late Monday, of an Amazon stock split, attracted a lot of attention along with demand, fueling options bets of another rally. Call volume yesterday with roughly 3 times the number of puts, according to Optimize Advisors CIO Michael Khouw on CNBC.
Expectations are that splitting the mega cap tech company’s expensive stock will increase its market share as more retail traders and investors will be able to afford it.
While we don’t know whether Amazon will exceed expectations tomorrow, even if it will finicky investors may not be impressed enough with the results. Still, over the longer term the future looks very bright for Amazon’s stocks, regardless of the immediate economic environment.
Trading Strategies
Conservative traders should wait for a close above the Apr. 13, $3,432 high, then for a return move that finds support above the flag, before committing to a long position.
Moderate traders would be content with a pullback they’d consider a buying dip.
Aggressive traders could enter at will, provided they have a plan that justifies the added risk of acting before the rest of the market, perhaps even prematurely.
Here is the basic set-up for a plan:
Trade Sample
- Entry: $3,400
- Stop-Loss: $3,350
- Risk: $50
- Target: $3,800
- Reward: $400
- Risk:Reward Ratio: 1:8
Author's Note: This is our interpretation based on historical behavior. We don't own a time machine and can't say what will happen in the future. Our analysis might be wrong.
Even if it’s right, when relying on statistical results, the same outcome isn't a given each time. And even if the stock were to follow through on its statistical pattern this time, this trade sample might still fail.
The object is not that each individual trade is a winner, but rather, that over time there are more wins than losses. The better you are at money management and knowing how to customize that to your timing, budget and temperament, the more likely you’ll be on the side of statistics. Till you learn how to develop that skill, you can use our samples, but only as a learning tool. If you hope to make big bucks, you’ll end up like most retail traders, out of money and convinced that trading is gambling.
In fact, without the necessary knowledge, it's you who are the gambler.
