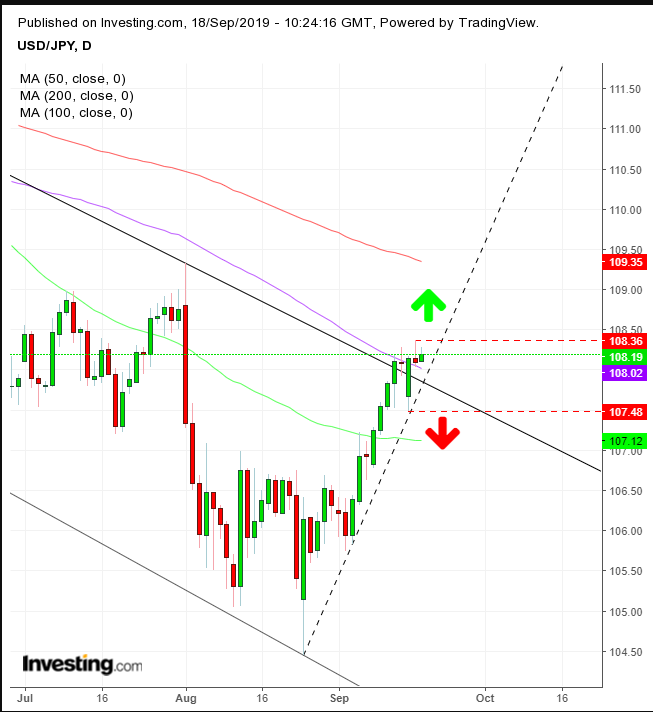
The dollar/yen pair is awaiting U.S. Federal Reserve and Bank of Japan interest rate decisions to determine whether to continue the downtrend or reverse to an uptrend. Here are the parameters to help gauge the trajectory.
Dollar and yen traders face considerable uncertainty. They need to figure out a host of market dynamics, which overlap and often contradict each other. Wall Street expects the Fed to cut 25 basis points now and another 25 basis points by year end in attempt to combat a global economic slowdown, recession fears and a trade war.
On the face of it, the lower rate would reduce the dollar’s yield, which should in turn push its price lower. On the other hand, the fact that a cut is widely expected may mean the move is already priced in. What about the dollar’s rate versus other currencies’ rates? The U.S. rate is, at least, not in negative territory.
Conversely — even though the dollar’s rate is higher than that of Japan — with the BoJ expected to hold its fire, the outlook for lower dollar rates puts the greenback into a falling momentum relative to the yen. On the flipside, Treasury demand overall has been rising globally as the ultimate haven, as well as because it provides a better yield than comparable counterparts.
Because of this convoluted headwind-tailwind whirlwind, traders have been sitting on the fence at a cutoff point between resuming the dollar-yen downtrend and a reversal.

The dollar-yen pair broke slightly above its falling channel top since late-March, pitting the short-term uptrend since the August lows against the falling channel since March.
The price is respecting the high of yesterday’s shooting star — a bearish signal — which found support above the 100 DMA – a bullish signal. Therefore, if the price closes above the shooting star, the probability of a continued short-term uptrend increases, till it tests the 200 MA above 109.
If, however, the price closes below the Sept. 16 low of 107.48, while still within the falling channel, we’d consider the odds to have increased for a continued downtrend, till the price tests the 50 DMA above 107.
While we use the 107.48 – 108.36 range as a short-term trend gauge, traders may use it for range trading.
Trading Strategies
Conservative traders would wait on a long position for the price to ascend above the 200 DMA, which would prove support after a pull back, or wait with a short position for the pair to fall below the 50 DMA, which would prove a resistance after an attempted rally.
Moderate traders would wait for the range breakout, preferably with a close.
Aggressive traders may range trade, and given that the price is near the top, they can take advantage of a lower risk position from a risk-reward perspective.
Trade Sample – Range Trading: Short Entry
- Stop-Loss: 108.40, round number above the high of yesterday’s shooting star
